


The portal offers a range of predefined views, divided into daily, monthly, yearly and total views.
On the right-hand side, all inverters are listed with name, serial number, yield and relative yield.
Below the chart, you can page forwards and backwards or jump to a selected date. You can also download the data as a file.
Daily views
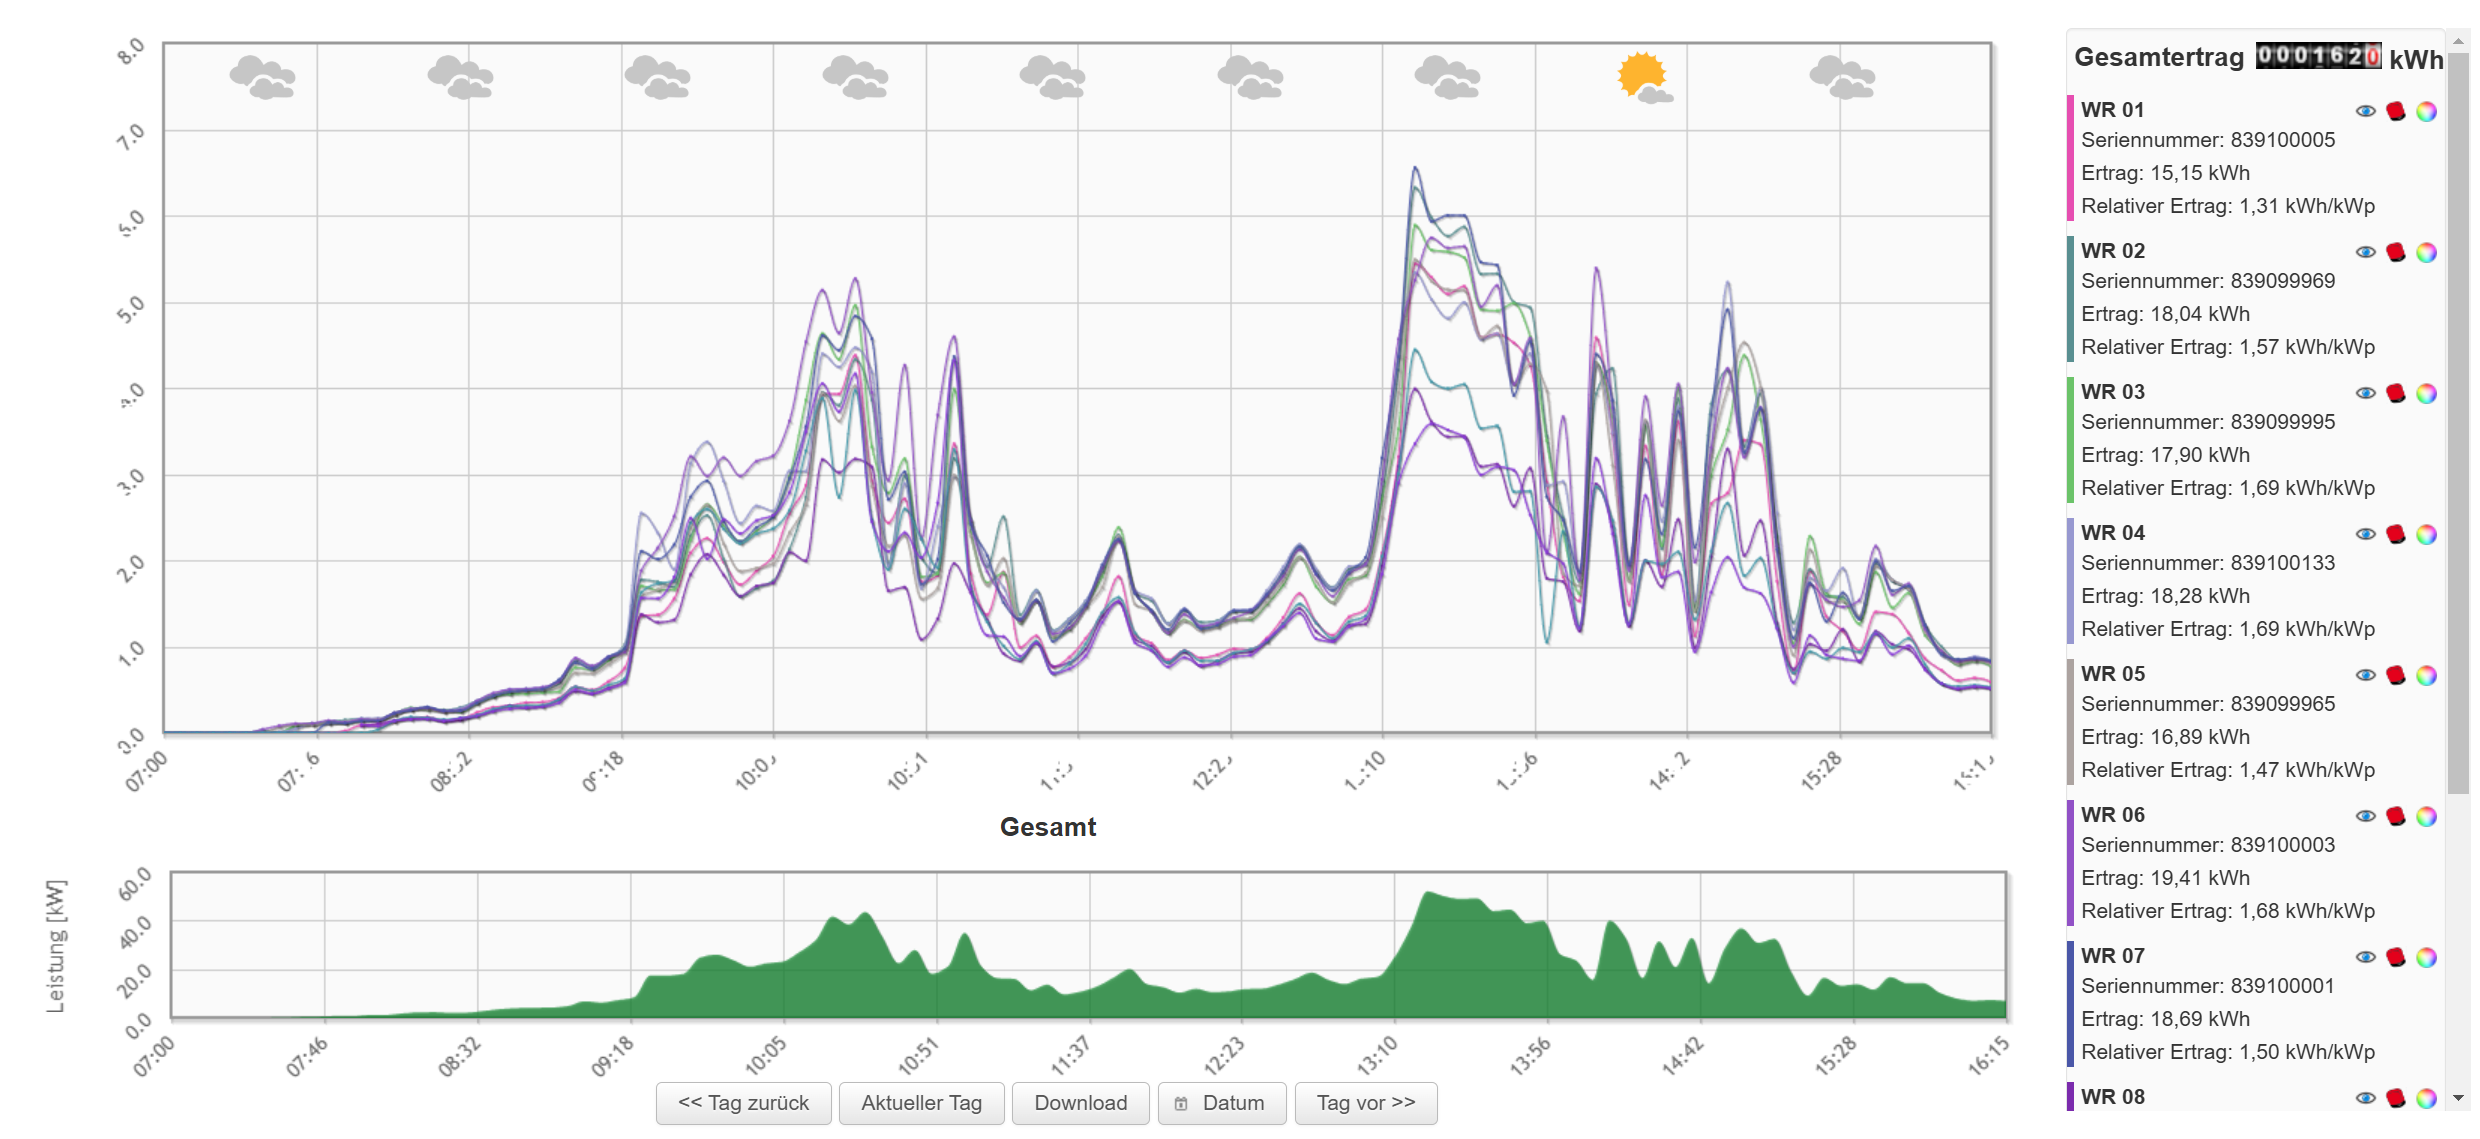
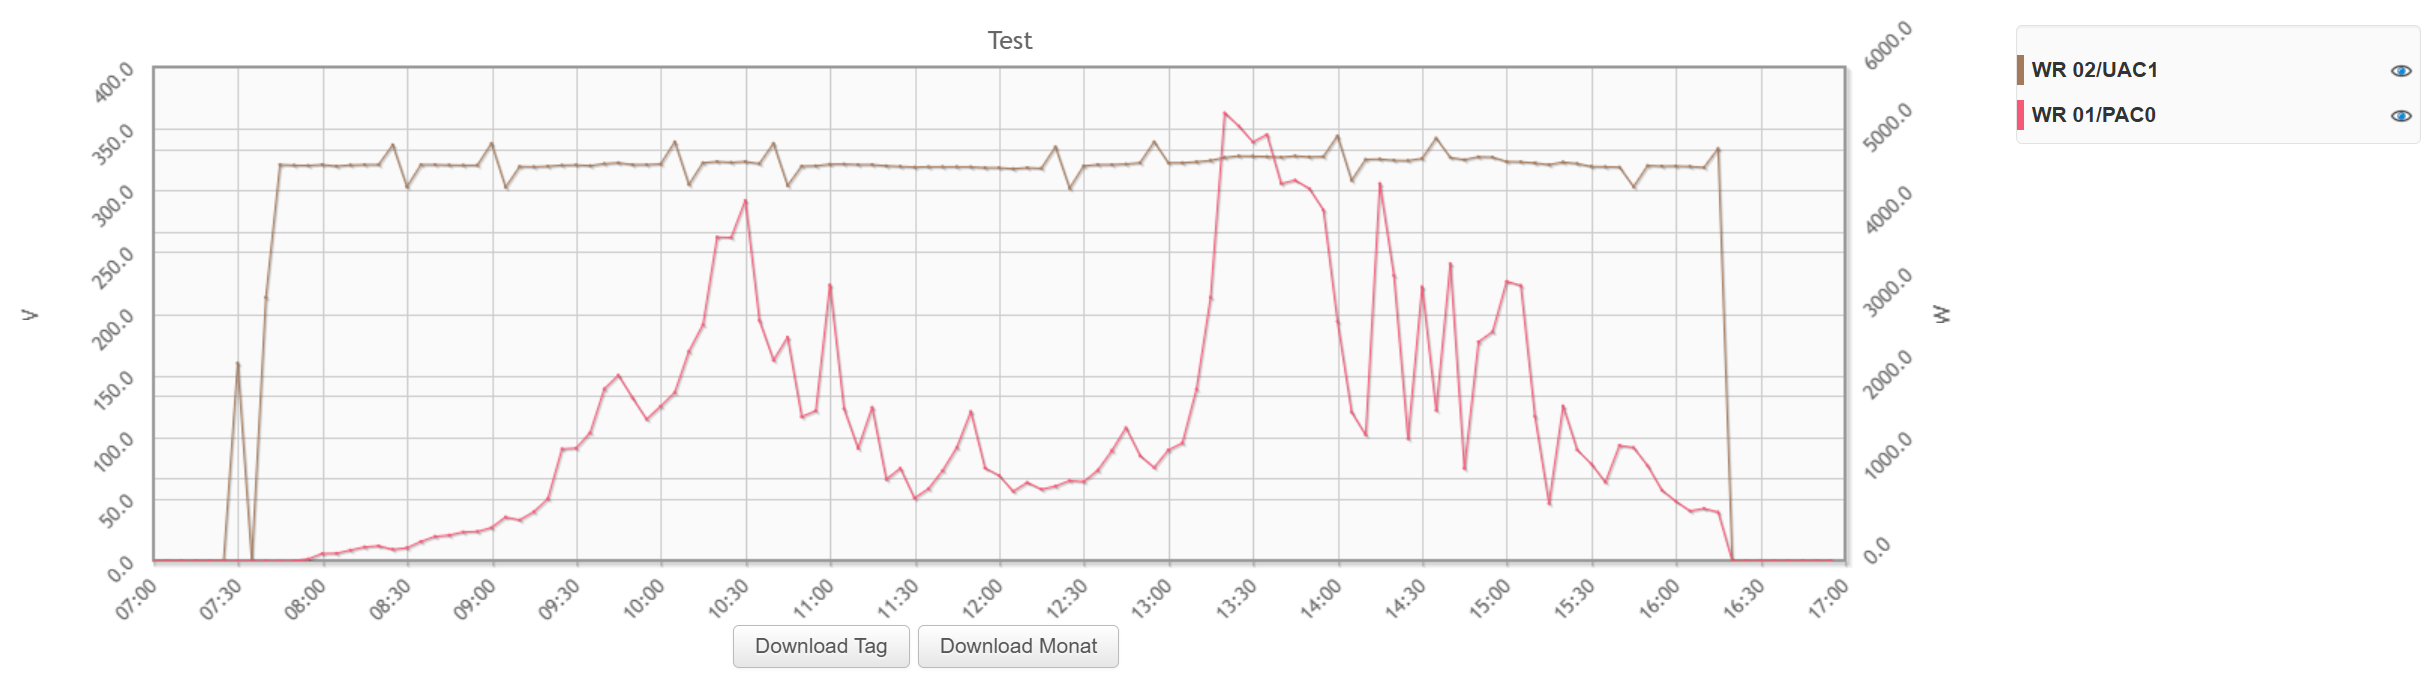
Daily curve
The upper view shows all inverters.
The lower view shows the total of all inverters.
Zoom: You can zoom in by dragging a rectangle. Double-click to return to the full view.
Hide: Individual inverters can be hidden using the "eye".
Colour: The colour of the inverter can be changed using the colour wheel.
MPP: The red inverter symbol takes you to the DC, AC and MPP charts.
Weather: The weather is shown above the chart. For this, you need to enter the postcode or the coordinates.
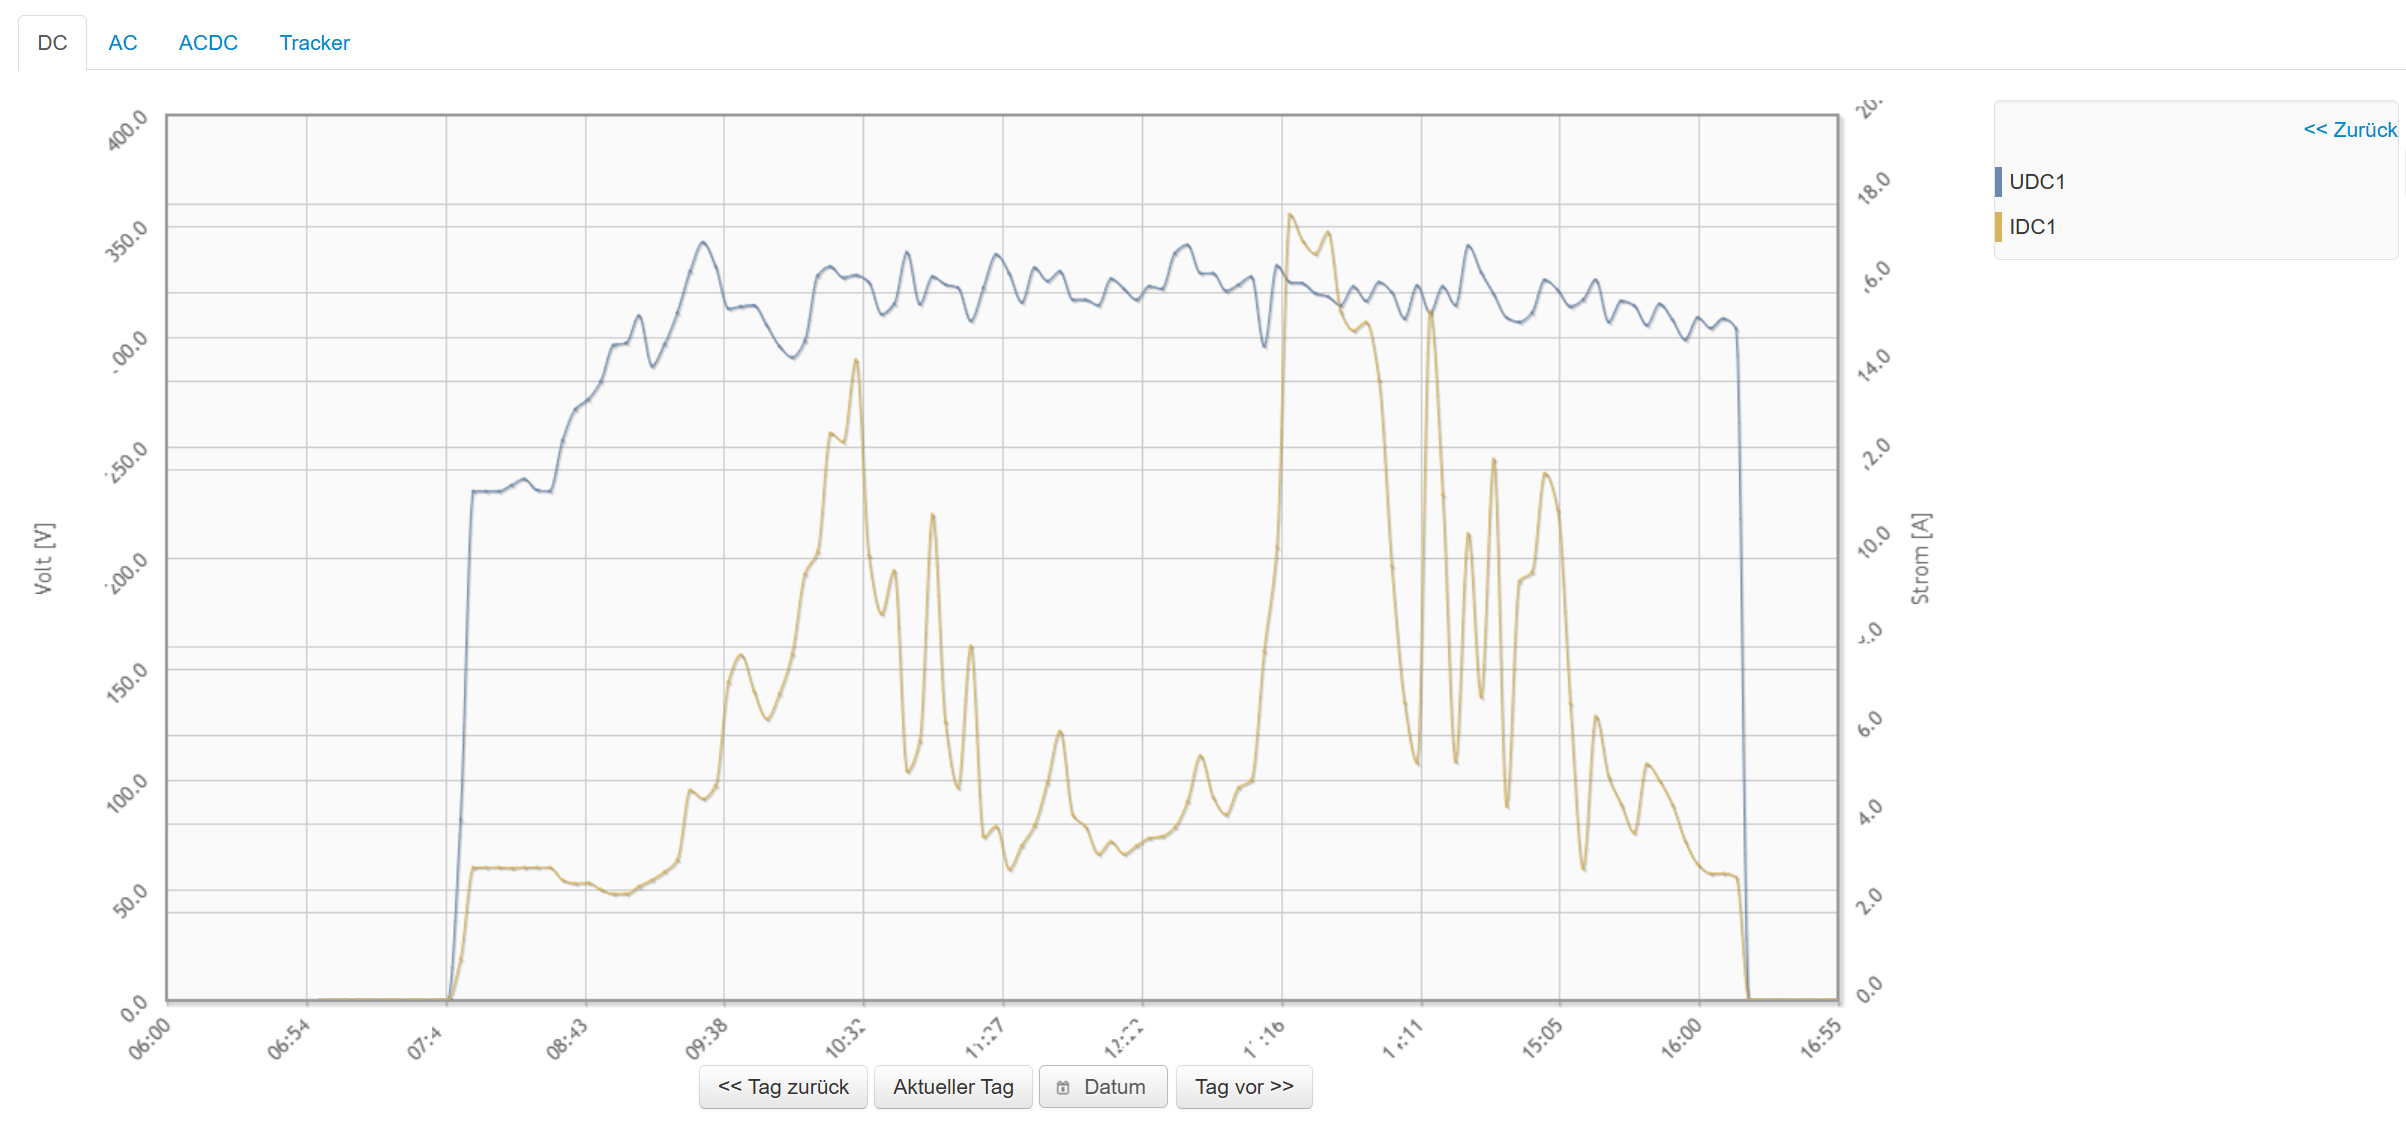
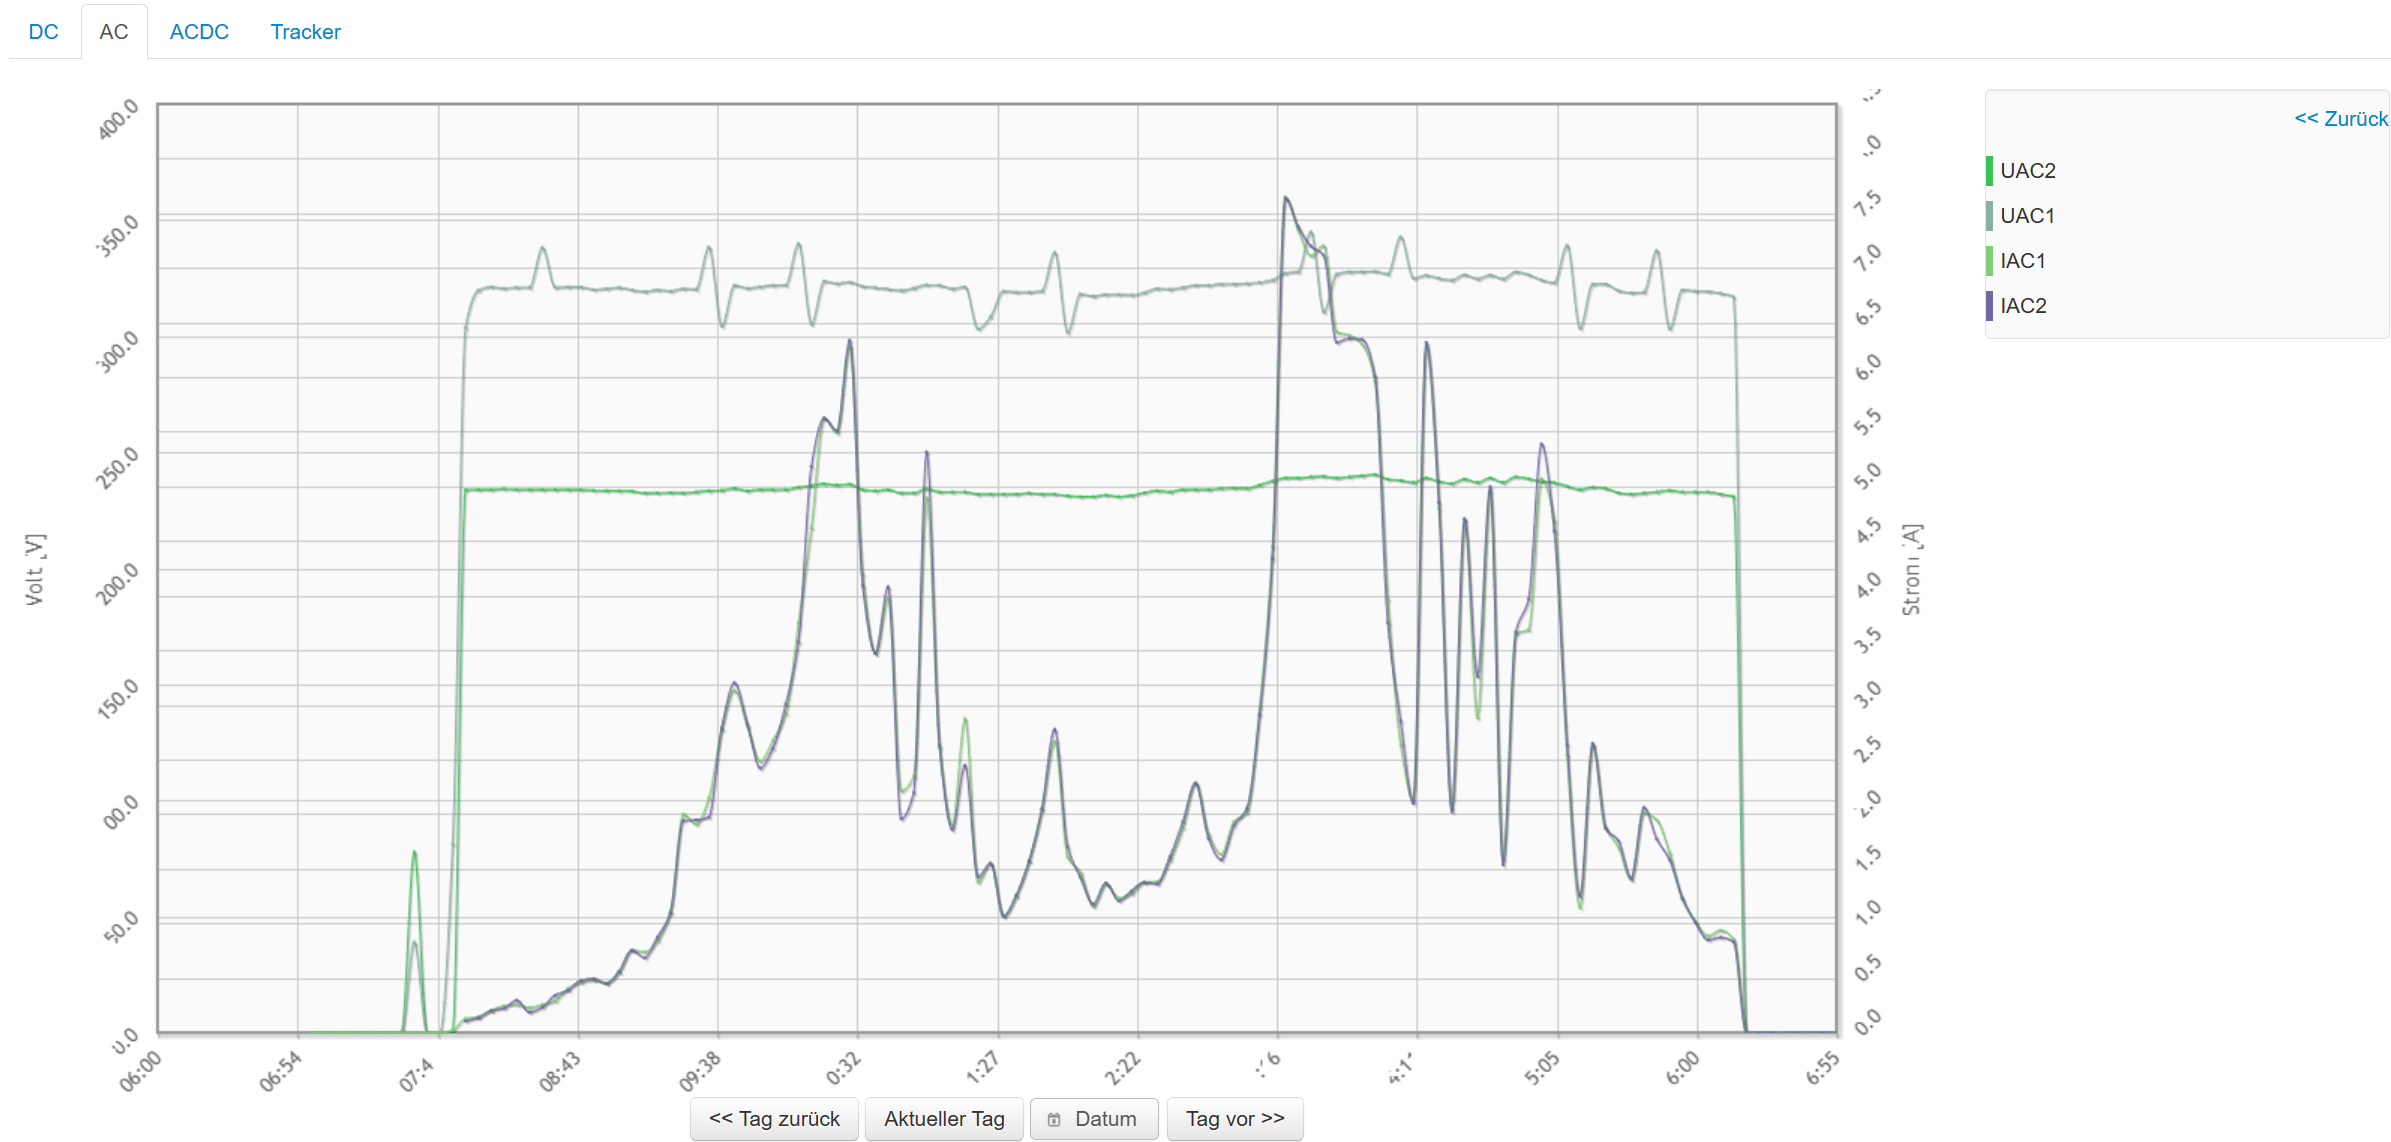
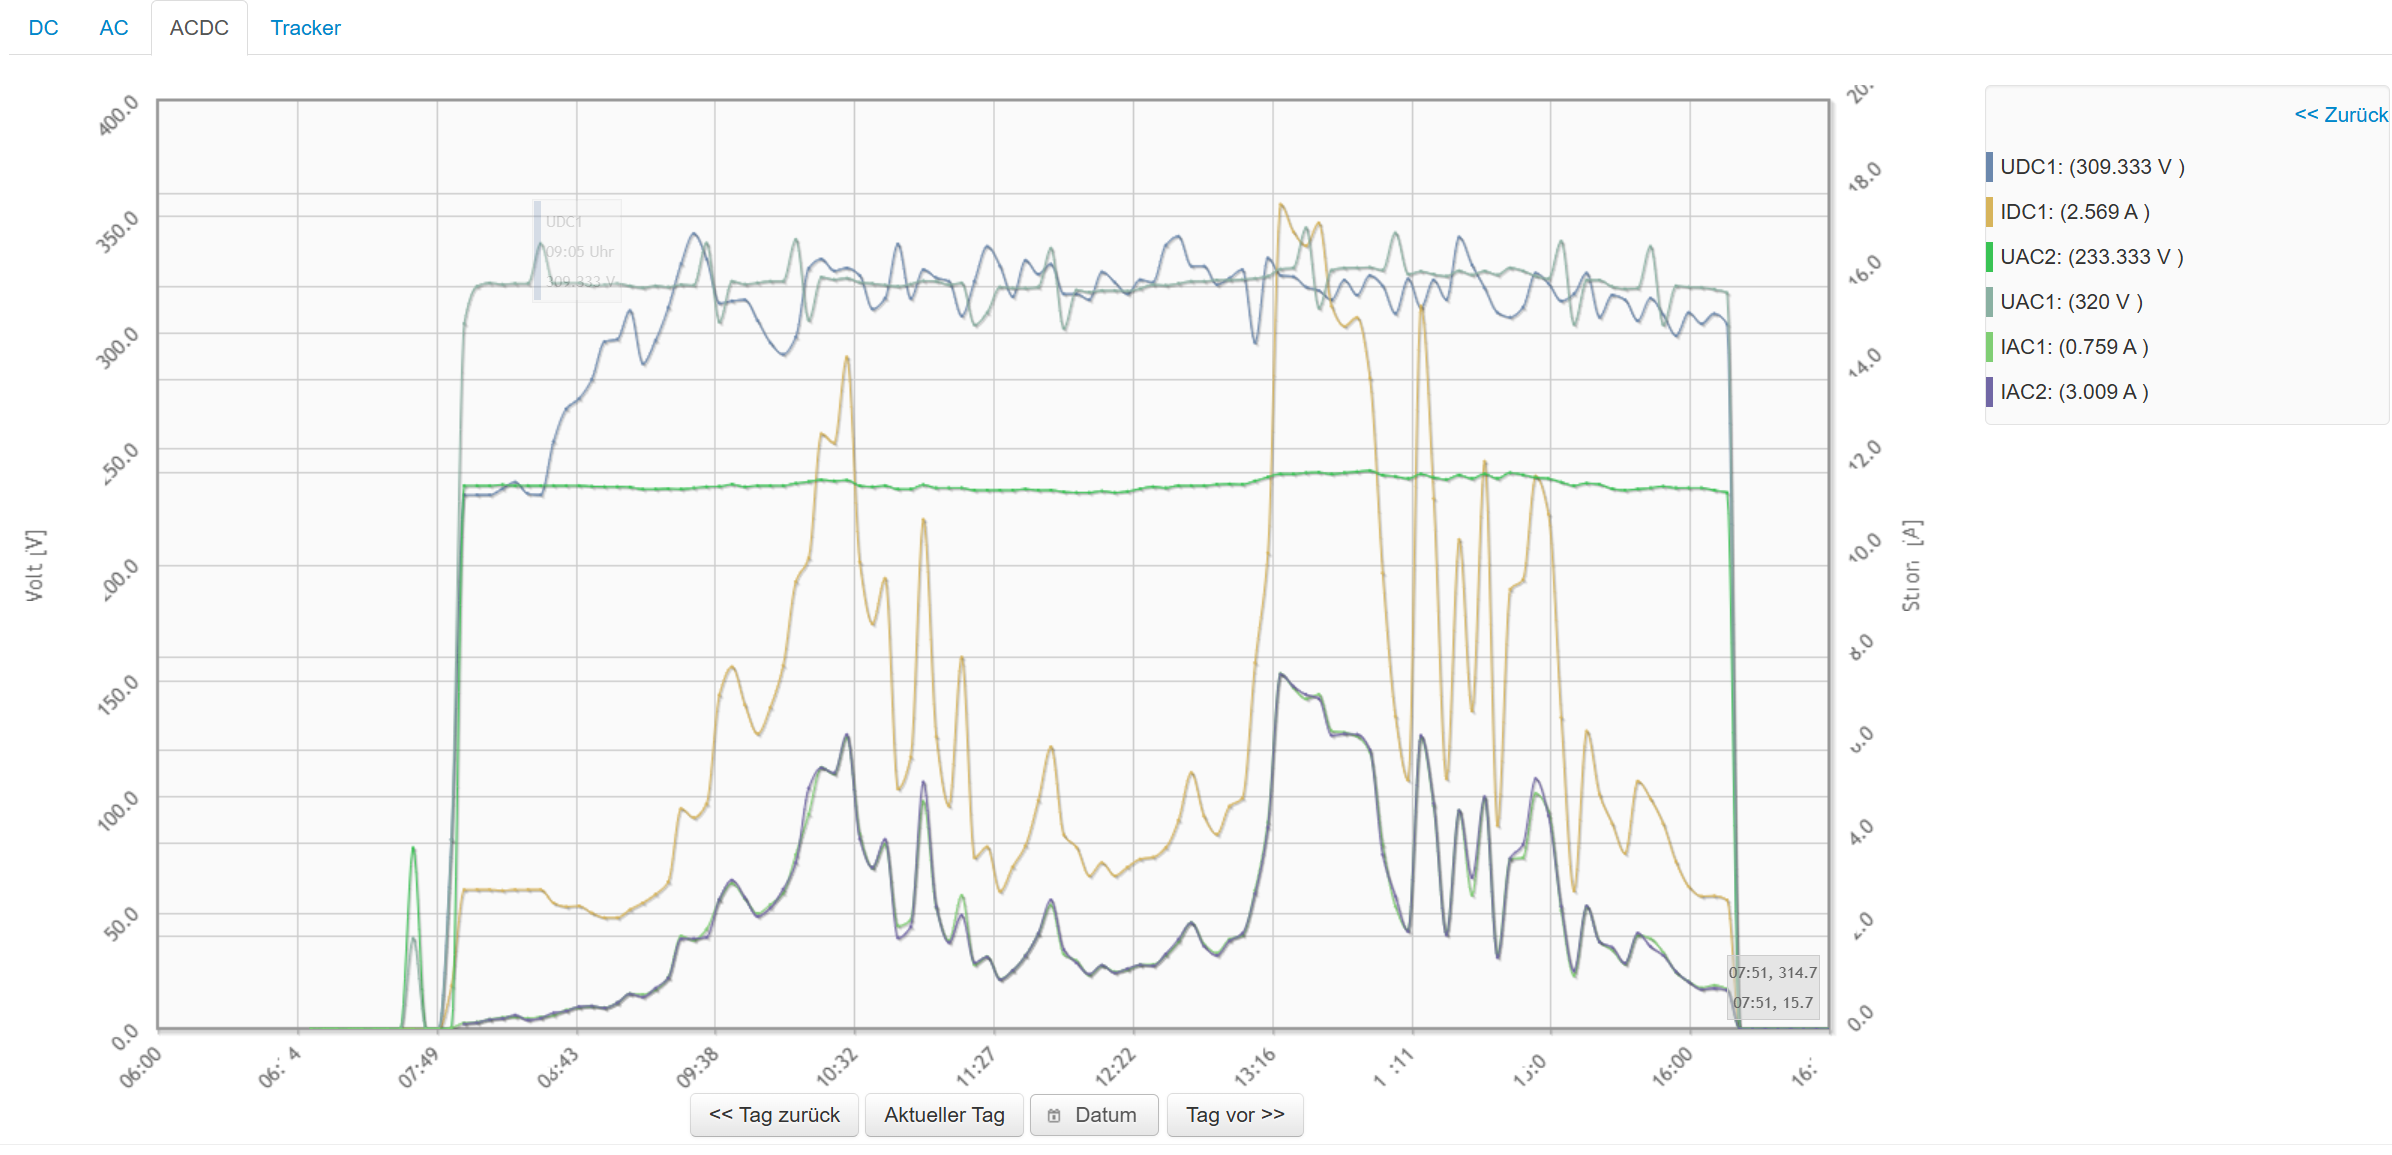
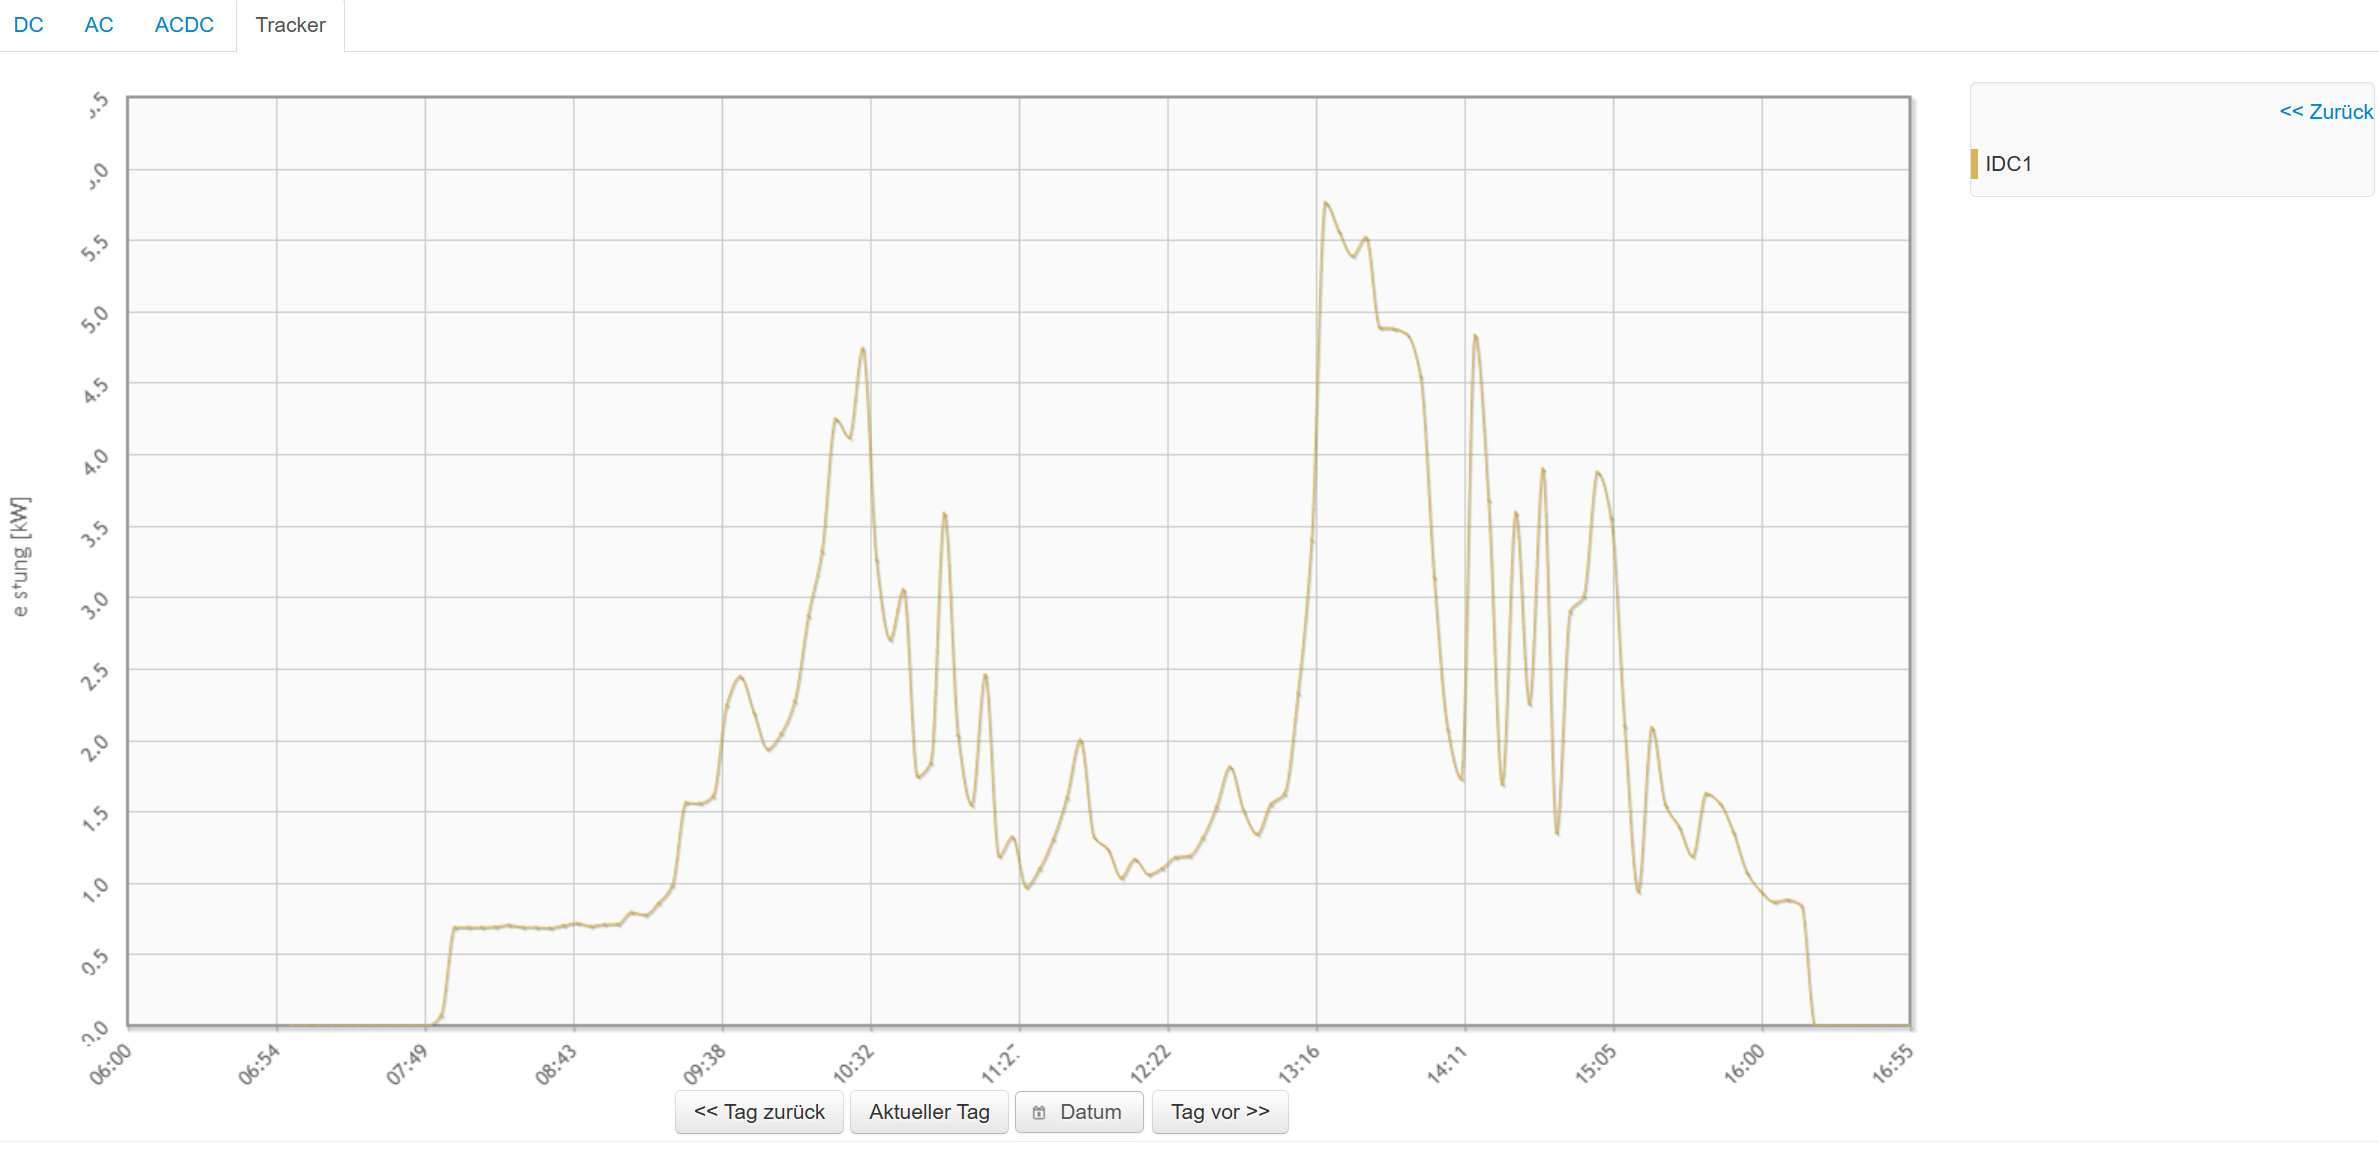
DC, AC and MPP
For data to be displayed, ACDC storage must be activated.
DC: All DC voltages and DC currents are shown here.
AC: All AC voltages and AC currents are shown here
ACDC: All AC and DC values are shown here
MPP: The power of the MPP trackers is shown here. For it to be displayed, you must configure the MPPs under Configuration => Devices by assigning voltage and current.
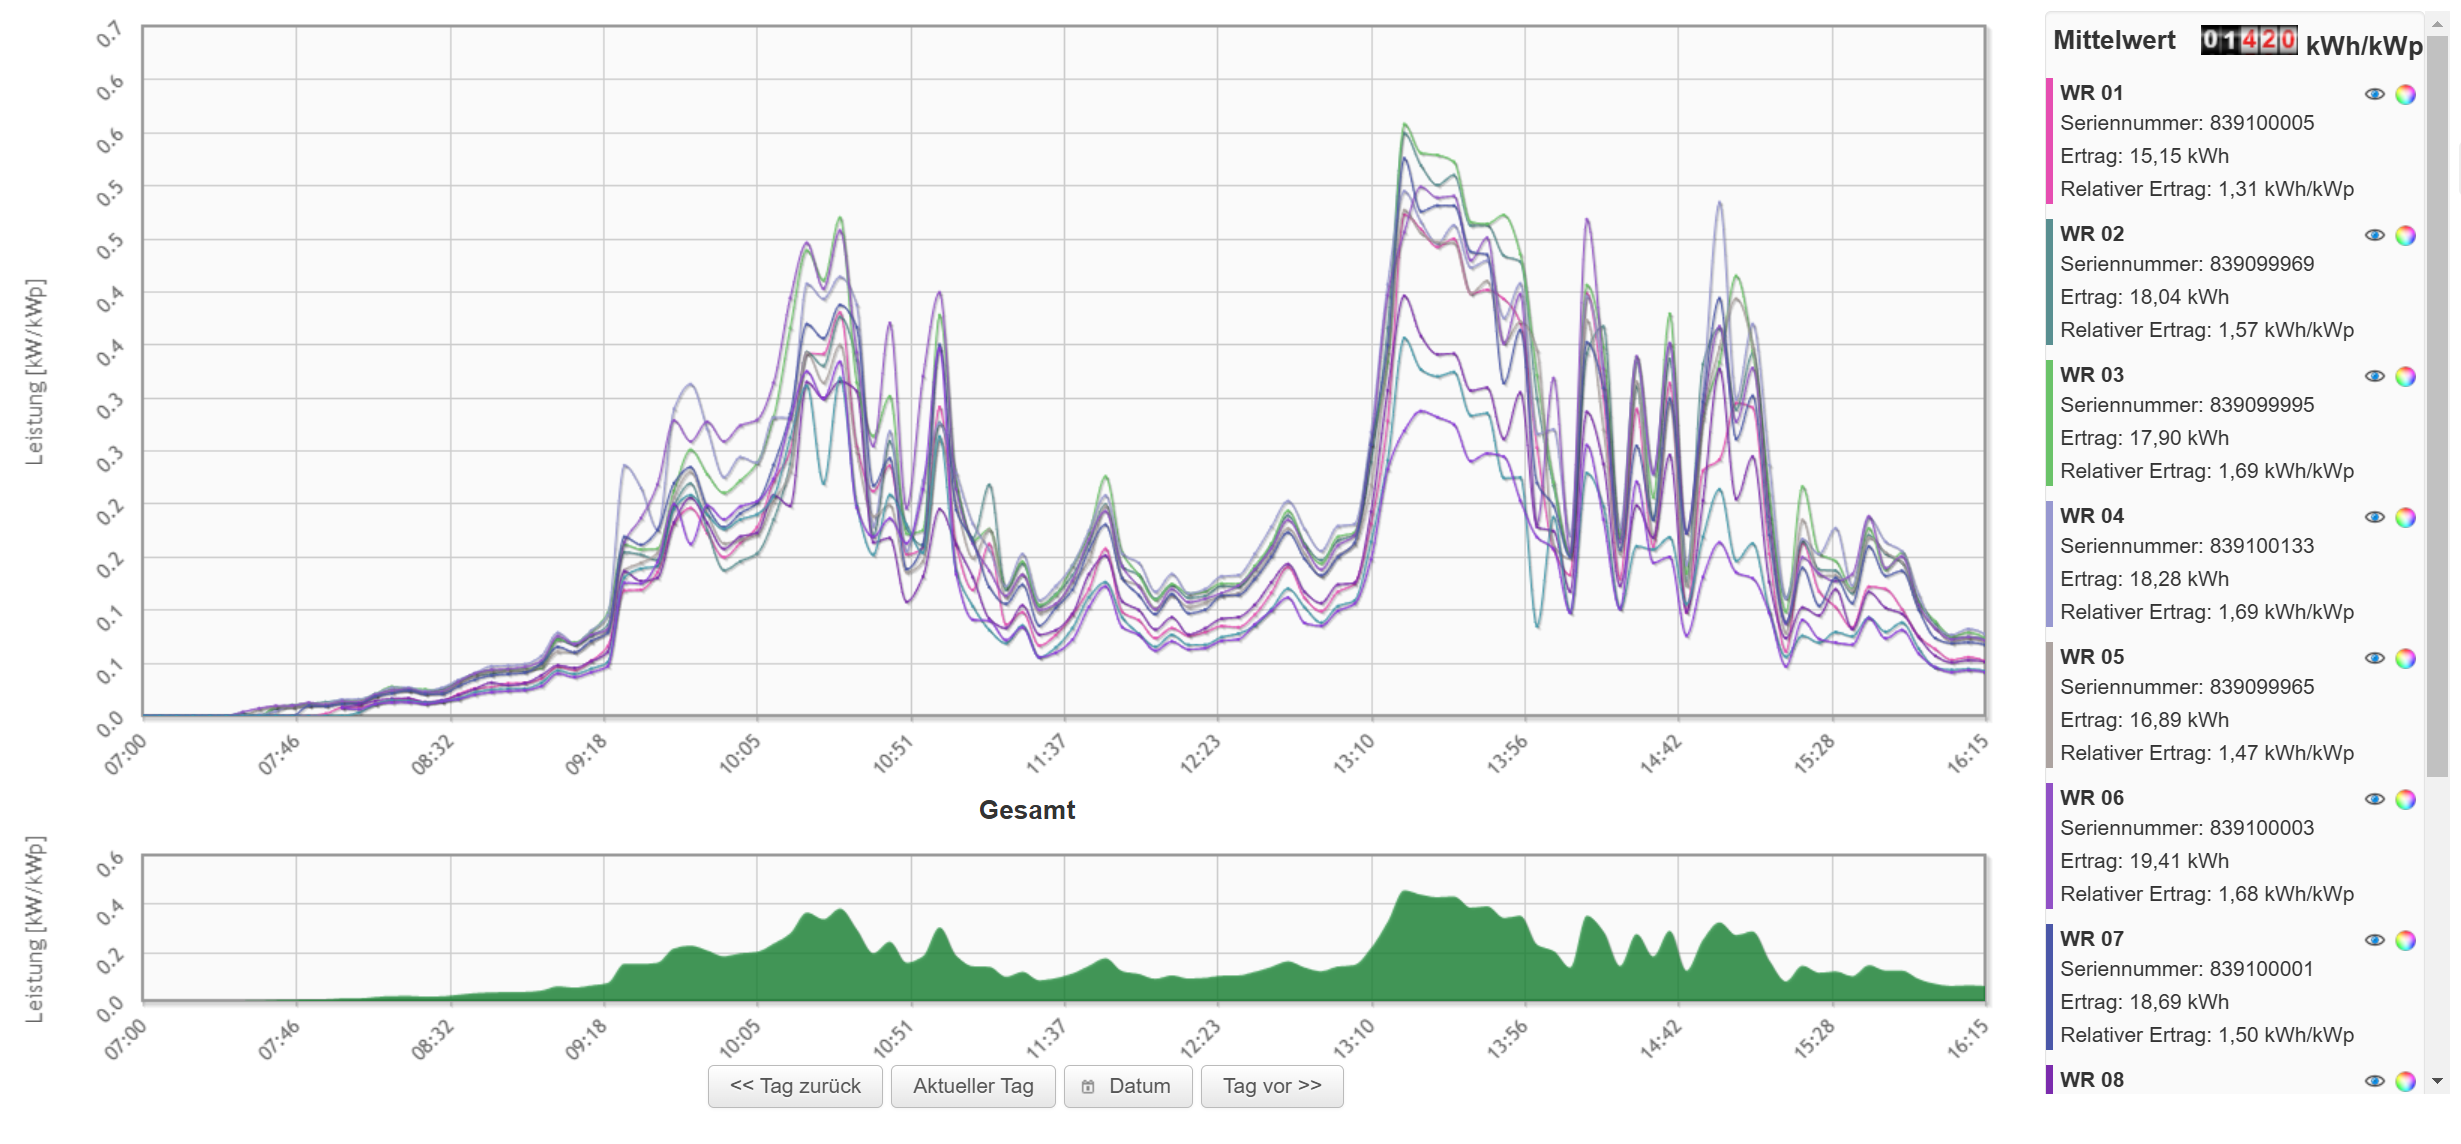
Relative daily curve
As with the daily curve, the relative daily curve shows all inverters. However, the values are normalised to 1 kWp. This allows inverters of different sizes to be compared with each other.
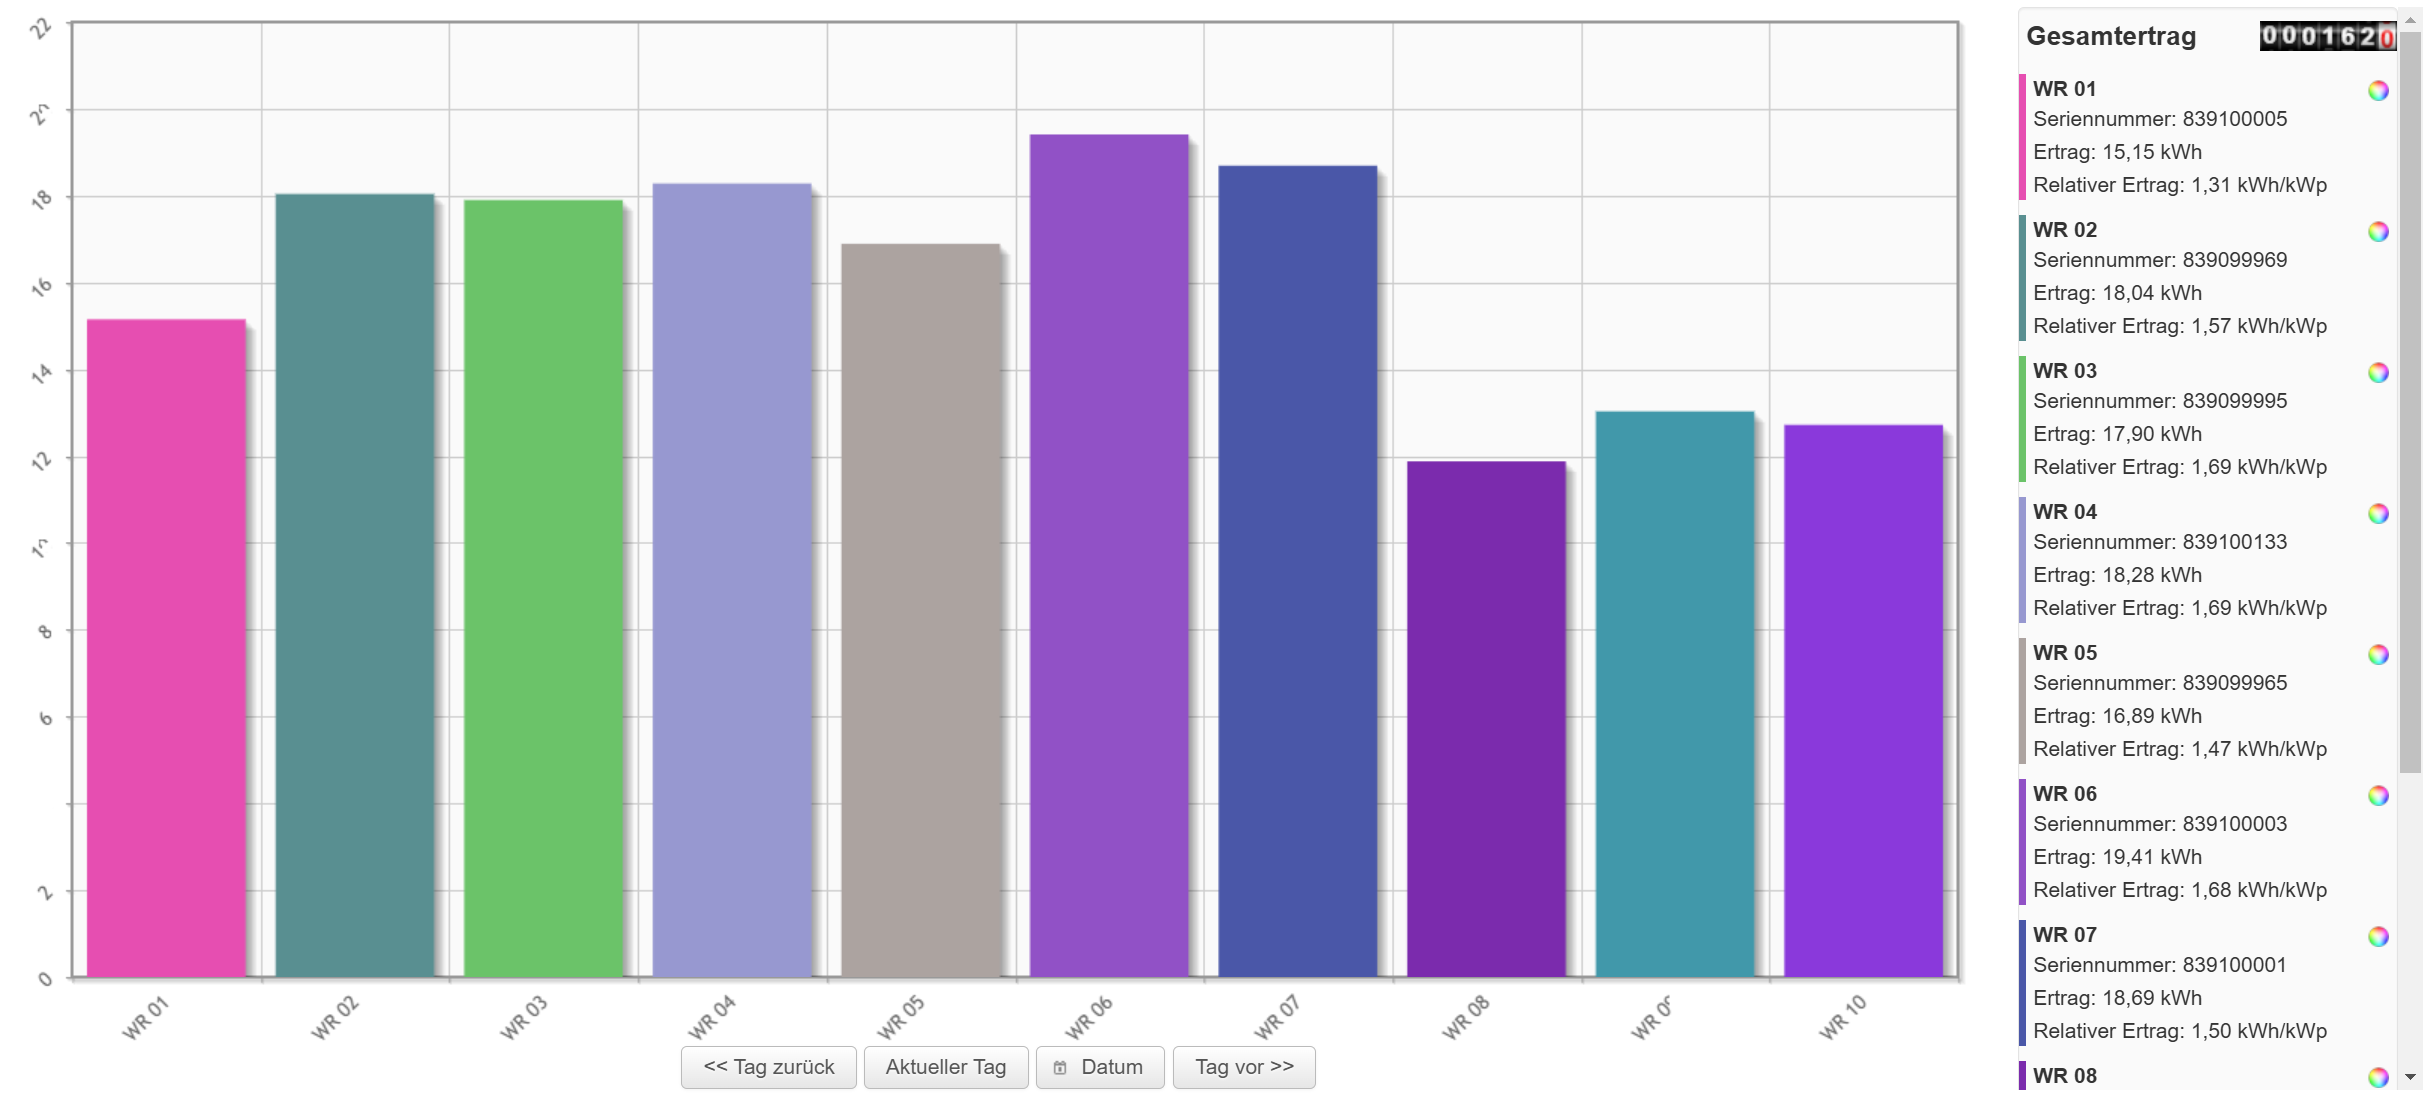
Inverter comparison
This shows the yields of all inverters.
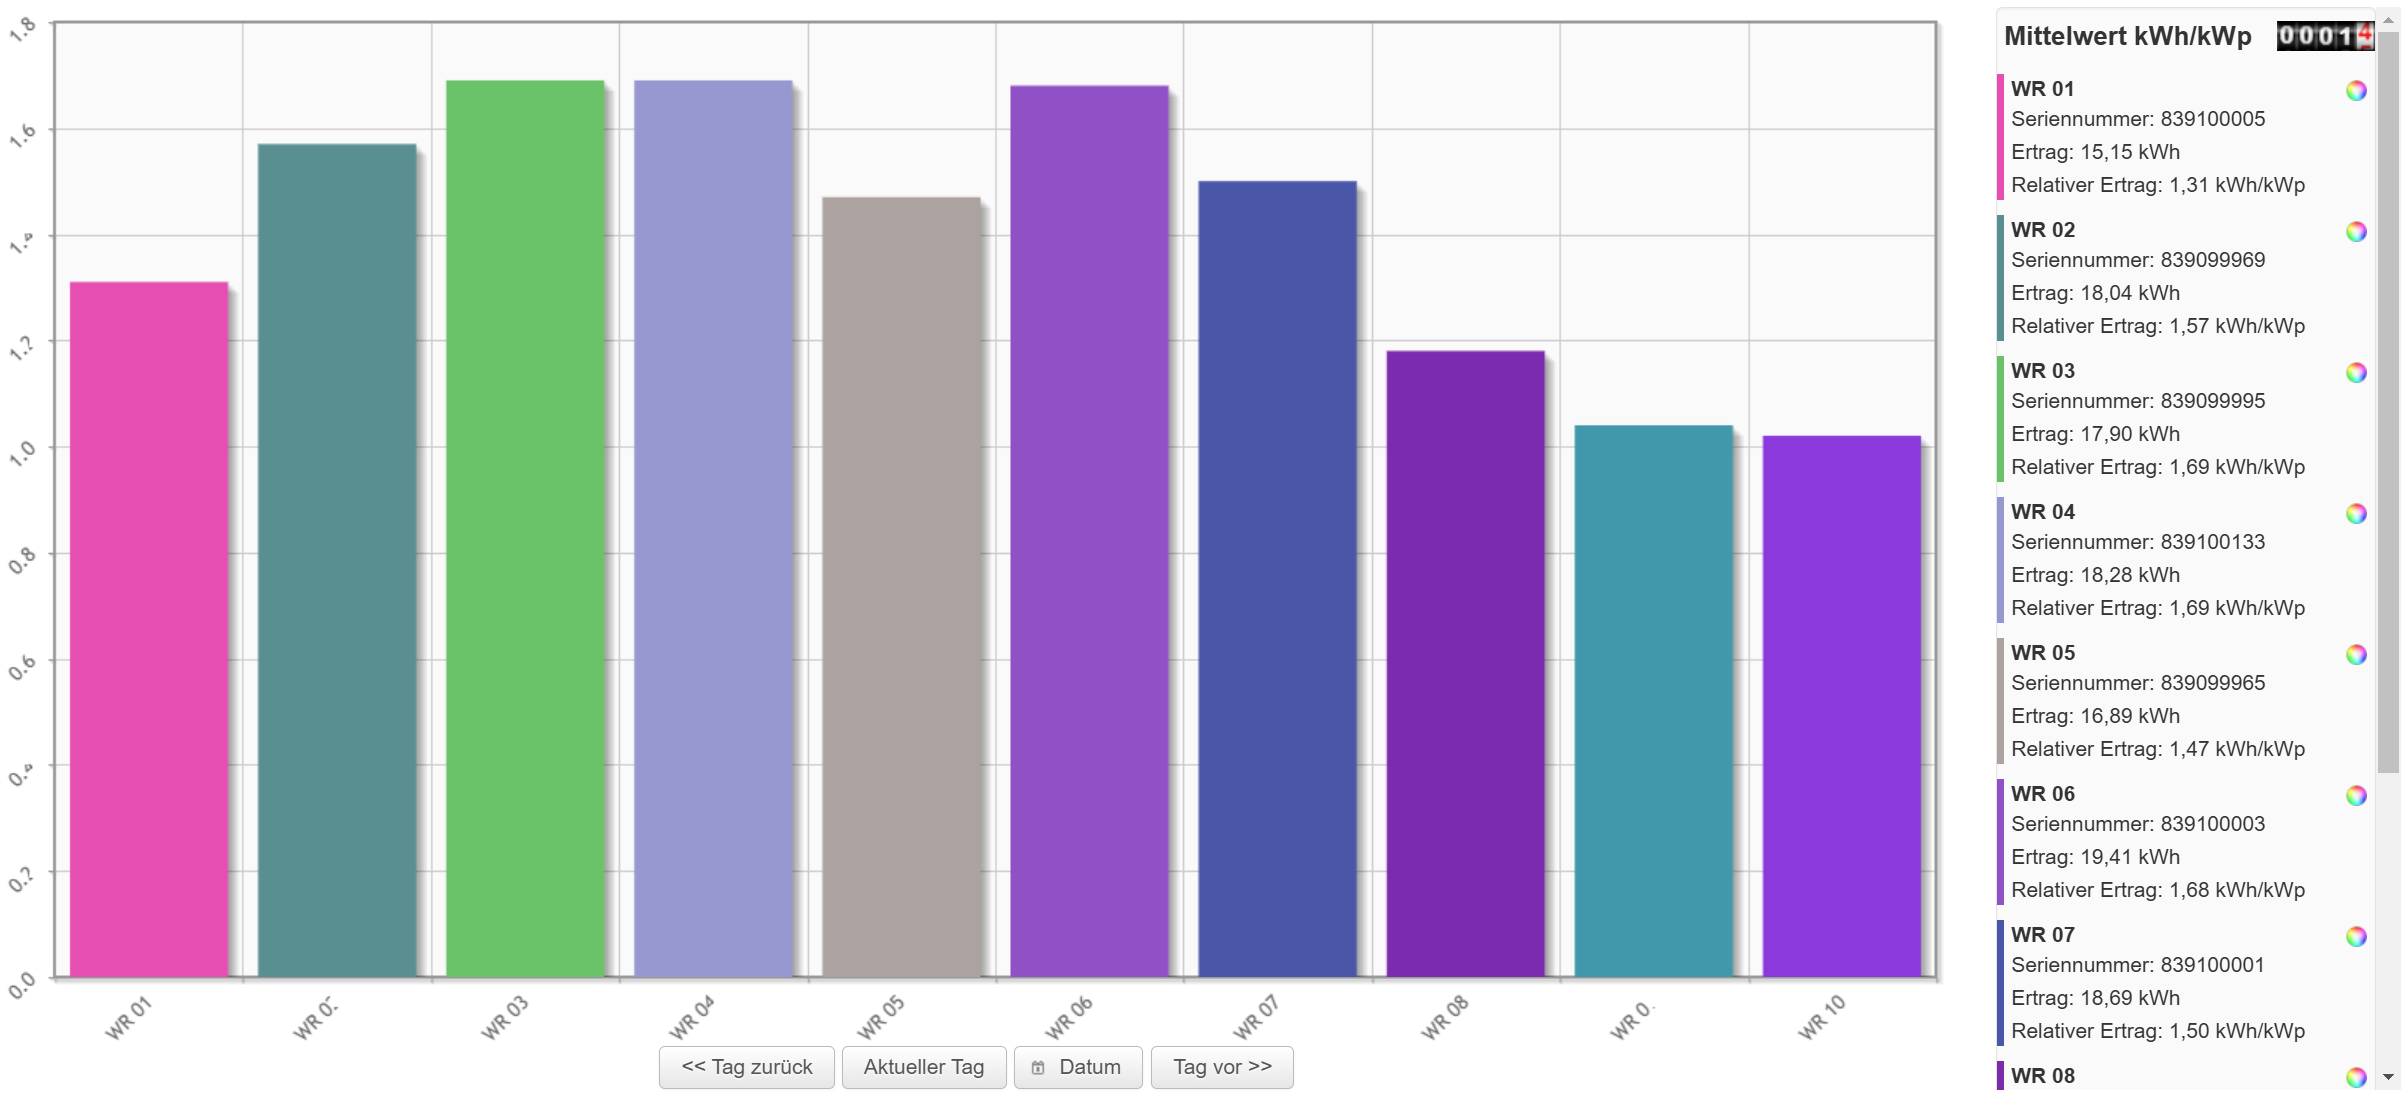
Relative inverter comparison
Display of the yields normalised to 1 kWp.
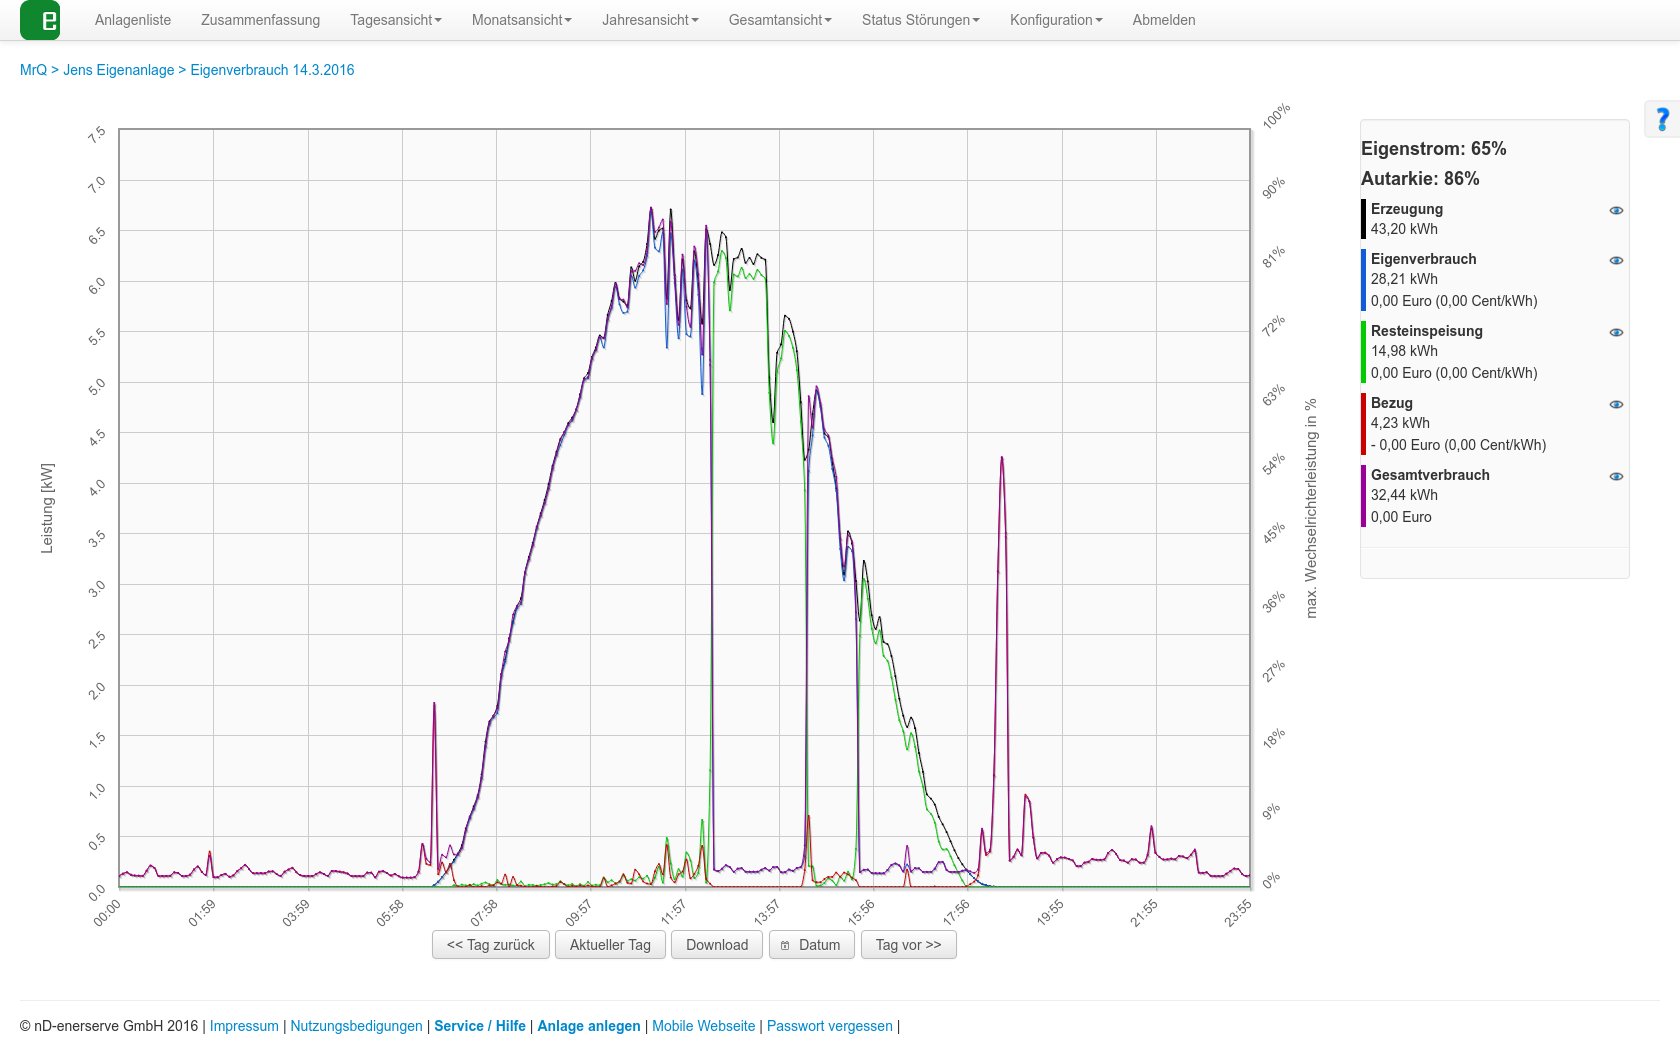
Self-consumption
If you have connected a feed-in meter to the e.manager, the curves are displayed here.
Generation power, grid purchase, feed-in, total consumption, self-consumption
With a battery system, charging and discharging power and the SOC are also displayed.
Charts
Under Charts, the charts that you have configured yourself are displayed. This lets you, for example, show the DC voltage of all inverters in one chart.
You can create the charts under Configuration => Charts.
Monthly views
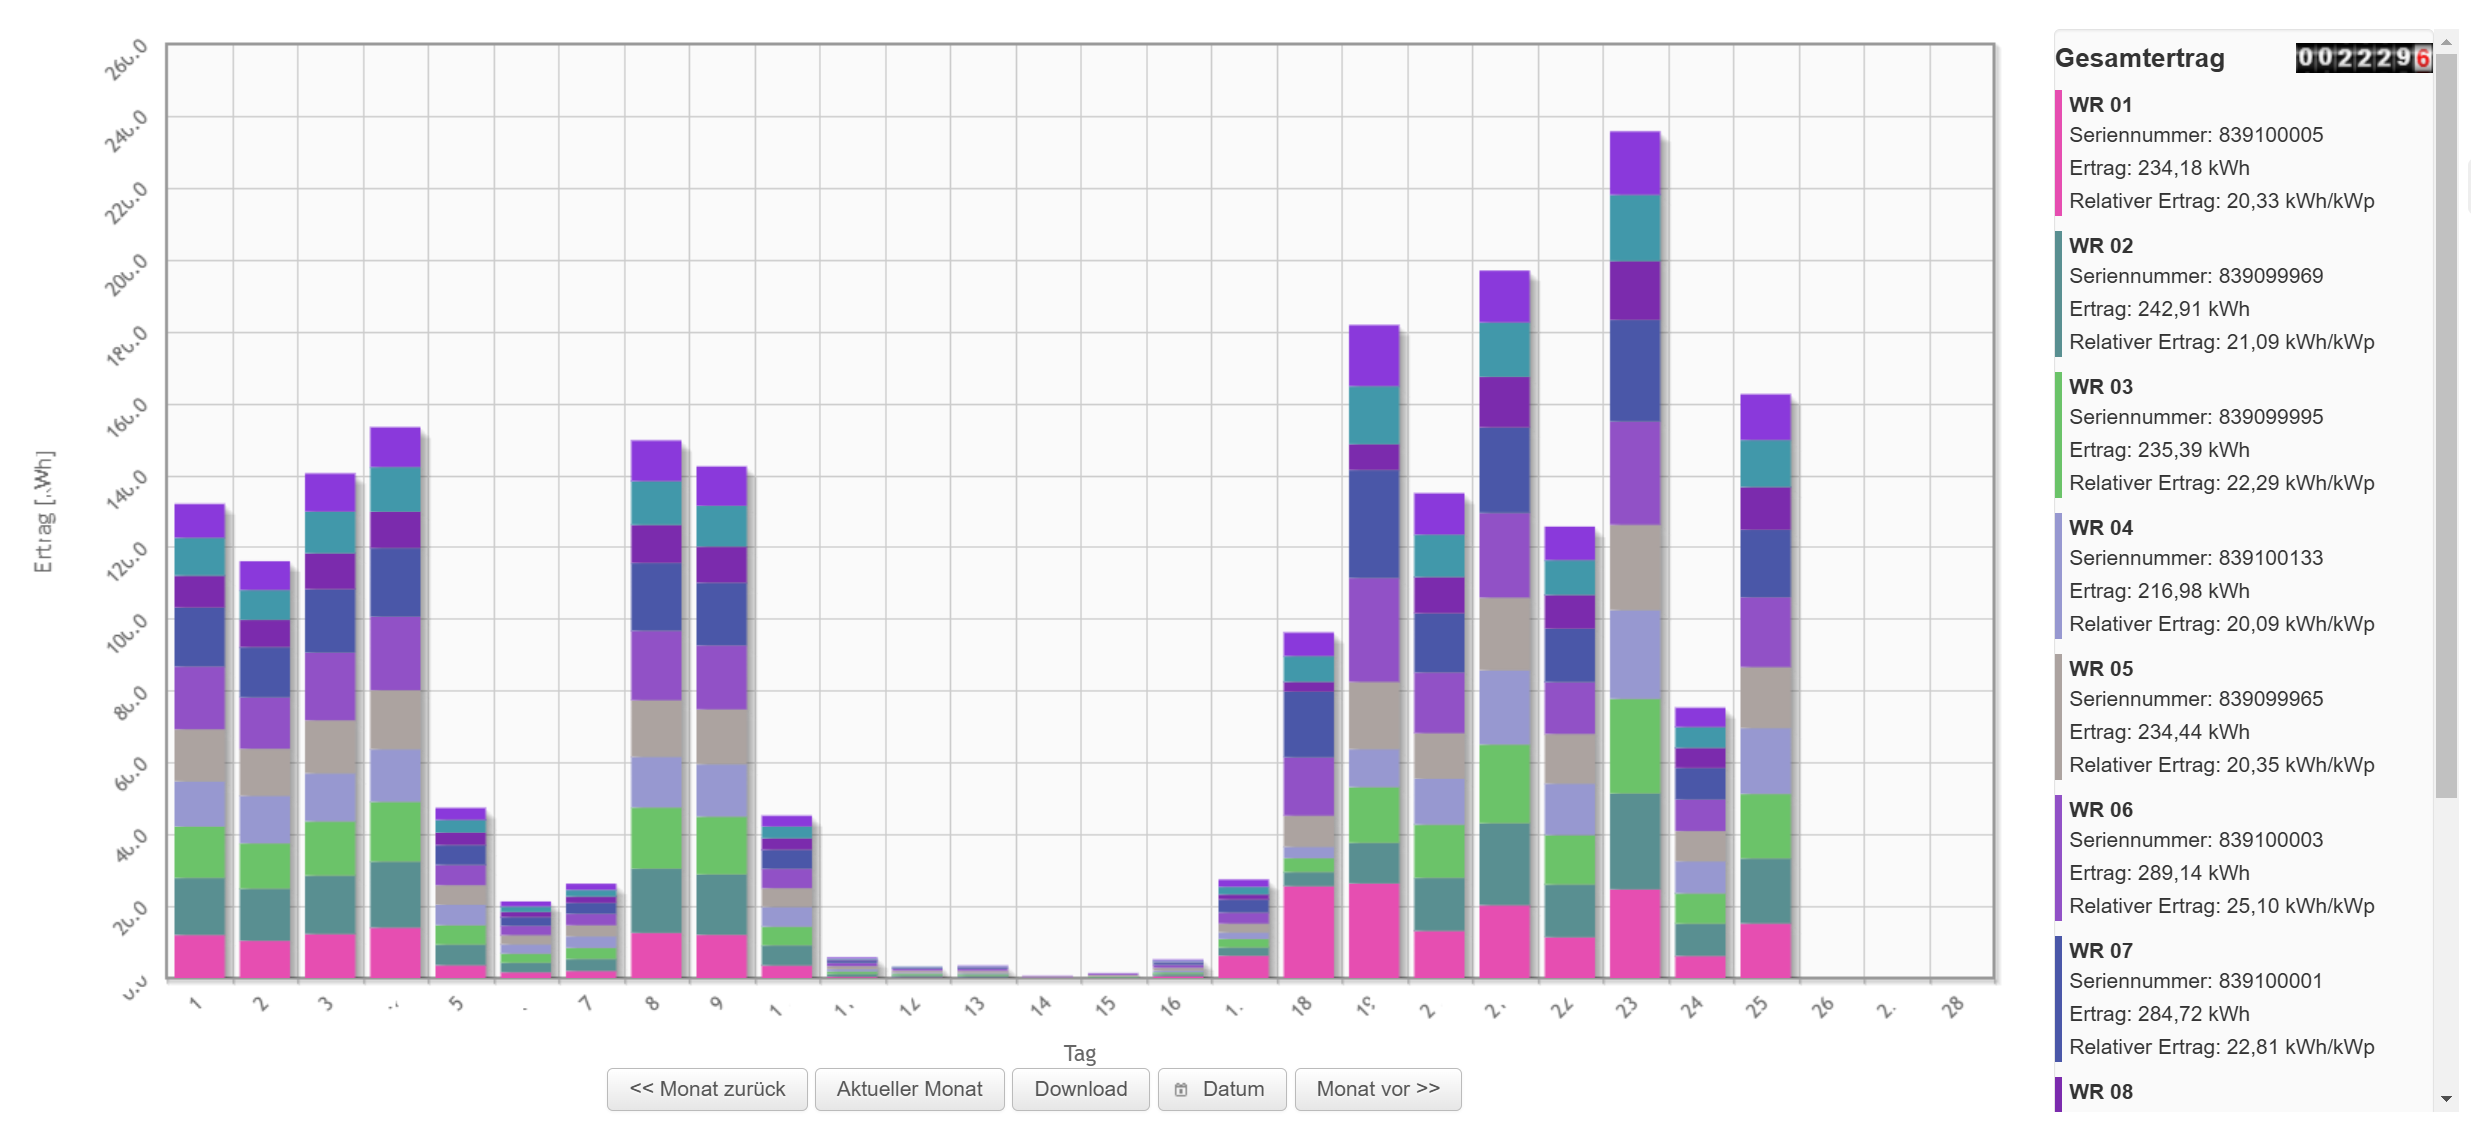
Monthly view
Yield overview of the individual inverters per day.
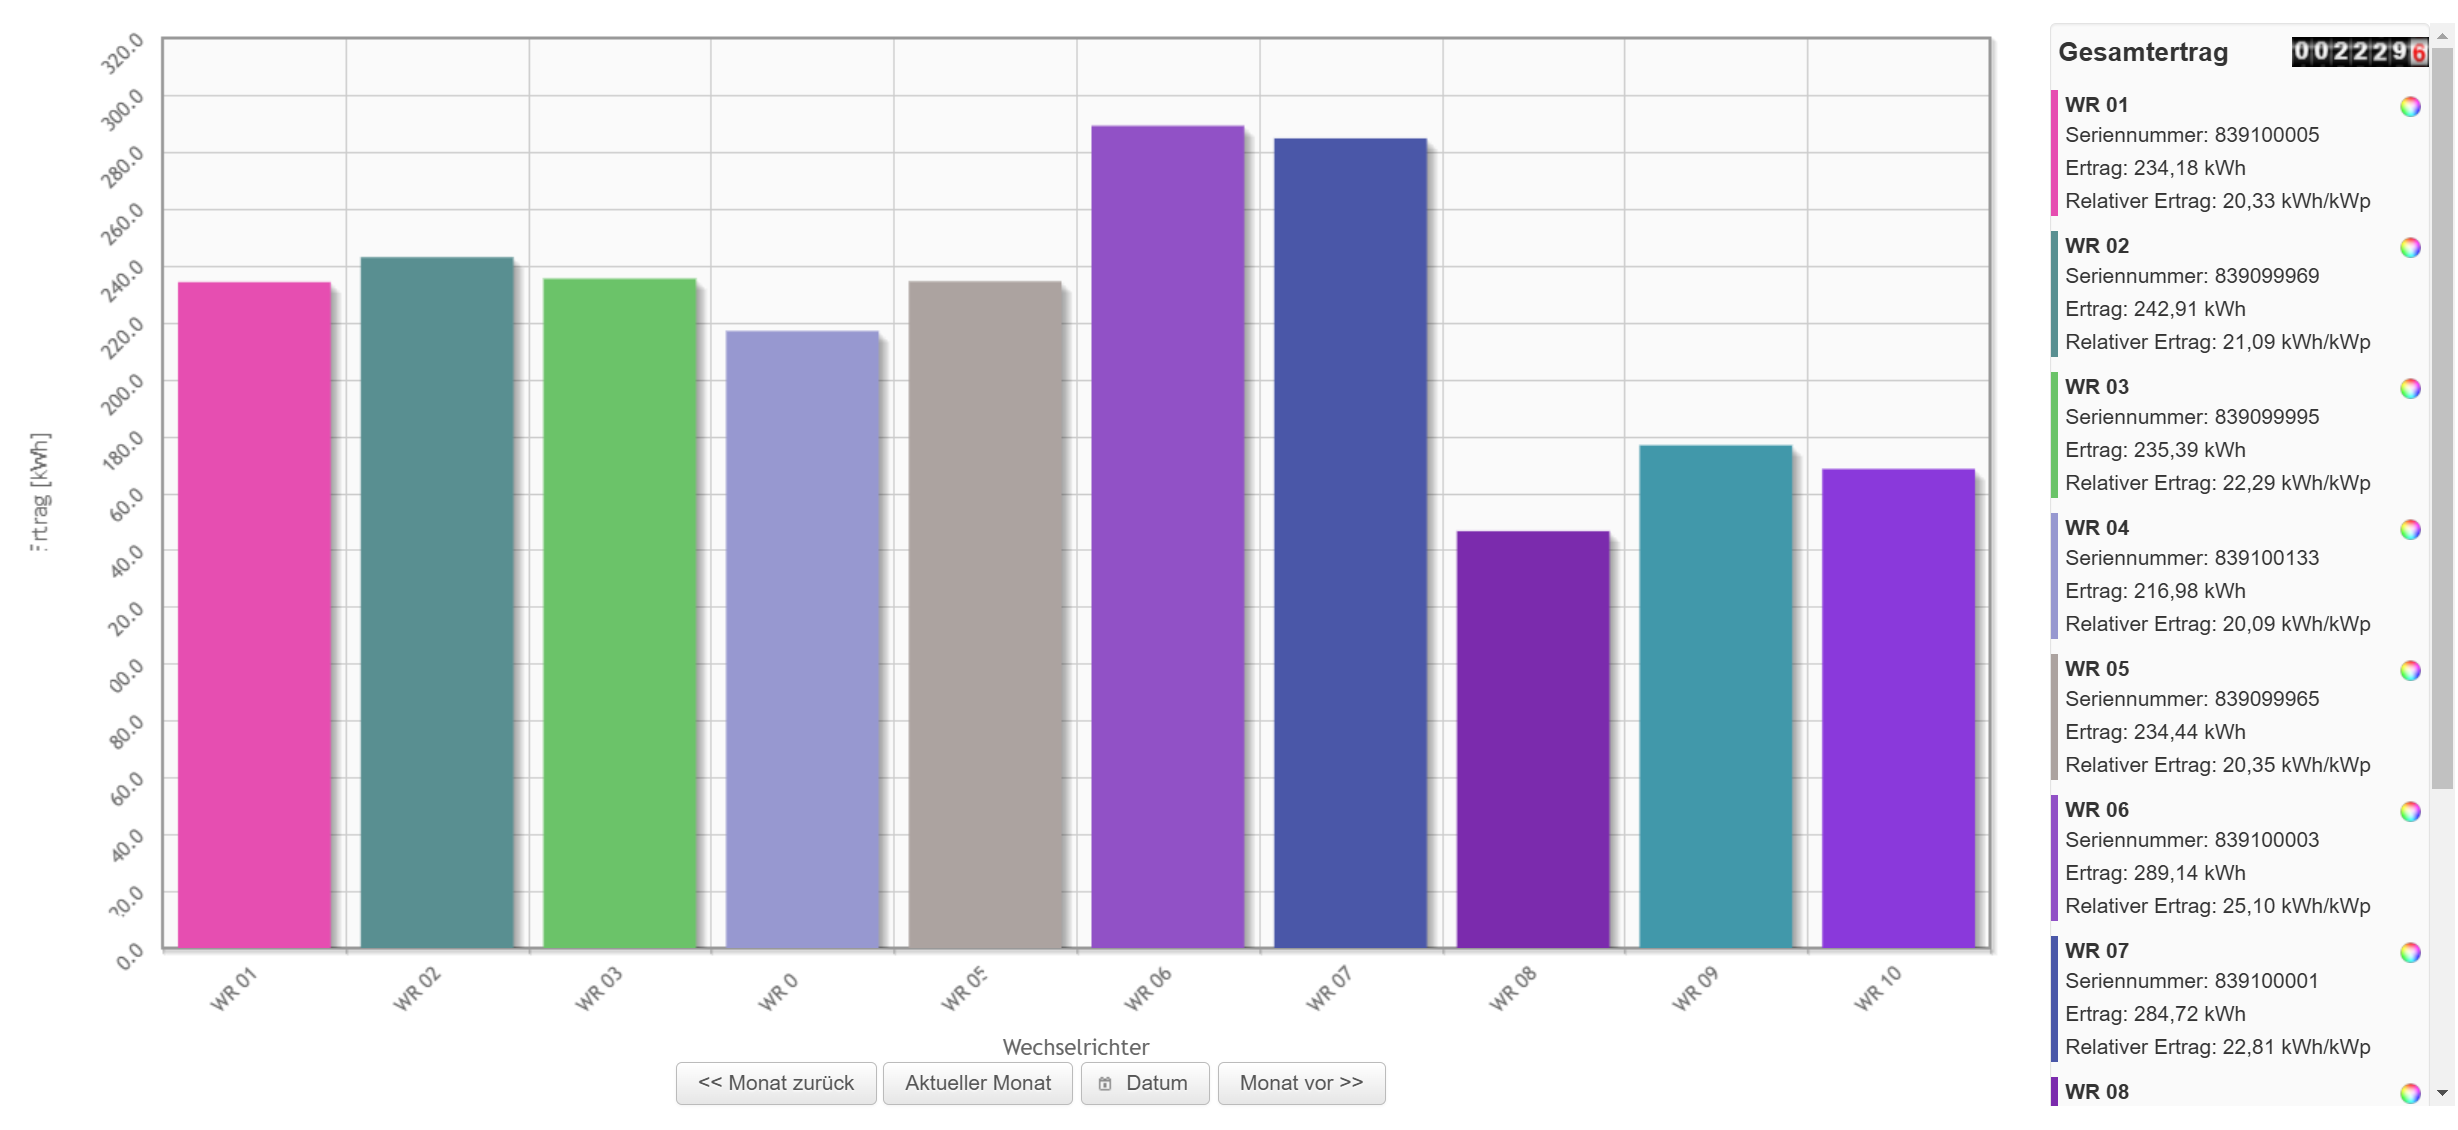
Inverter comparison
Total yield for the month per inverter.
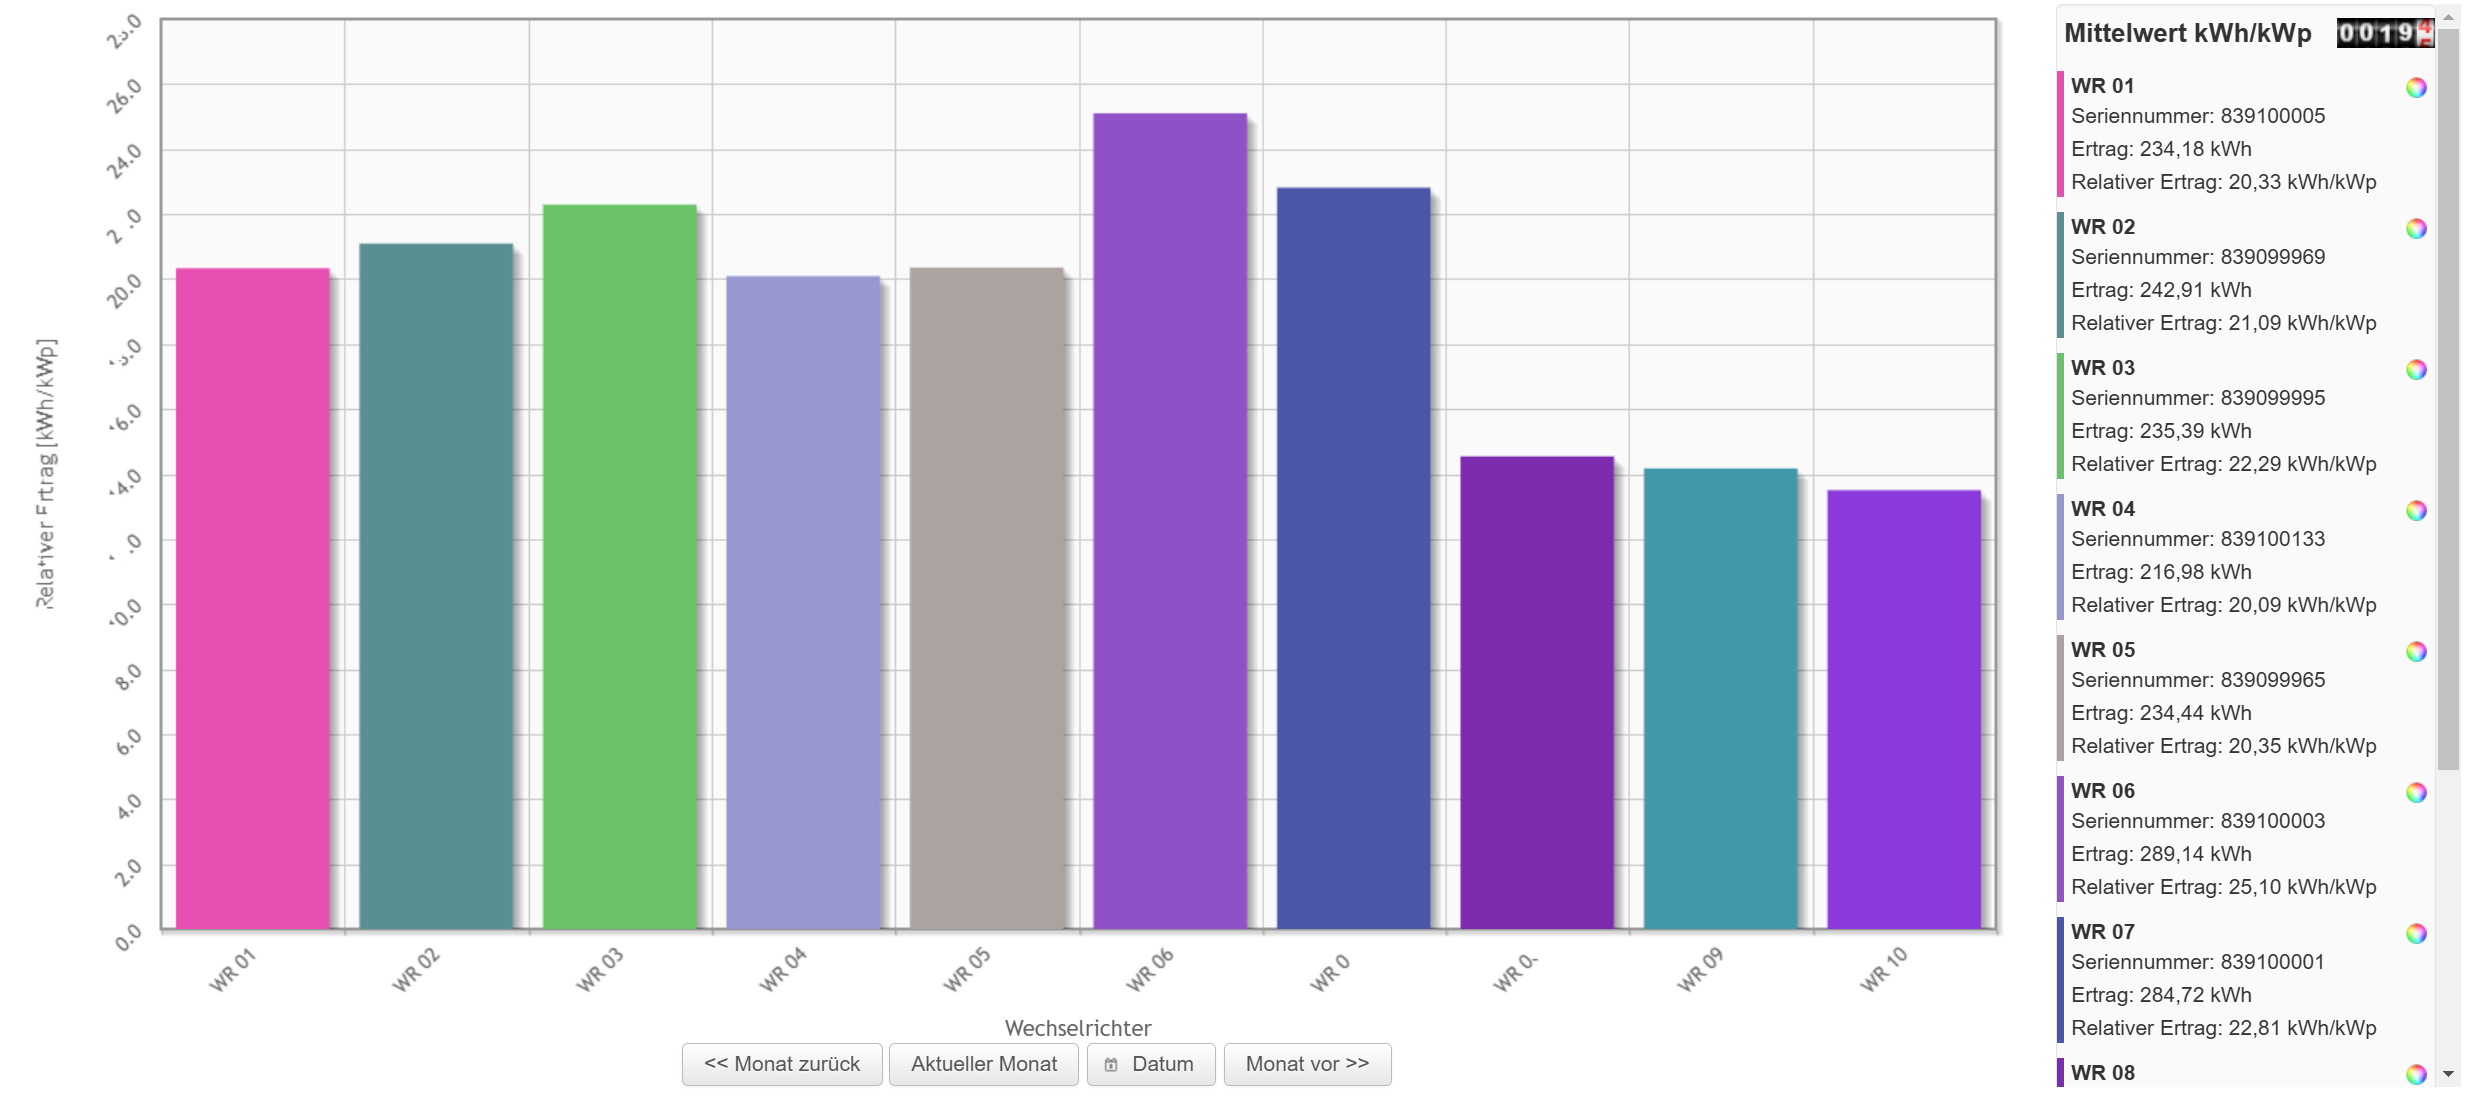
Relative inverter comparison
Normalised yield for the month per inverter.
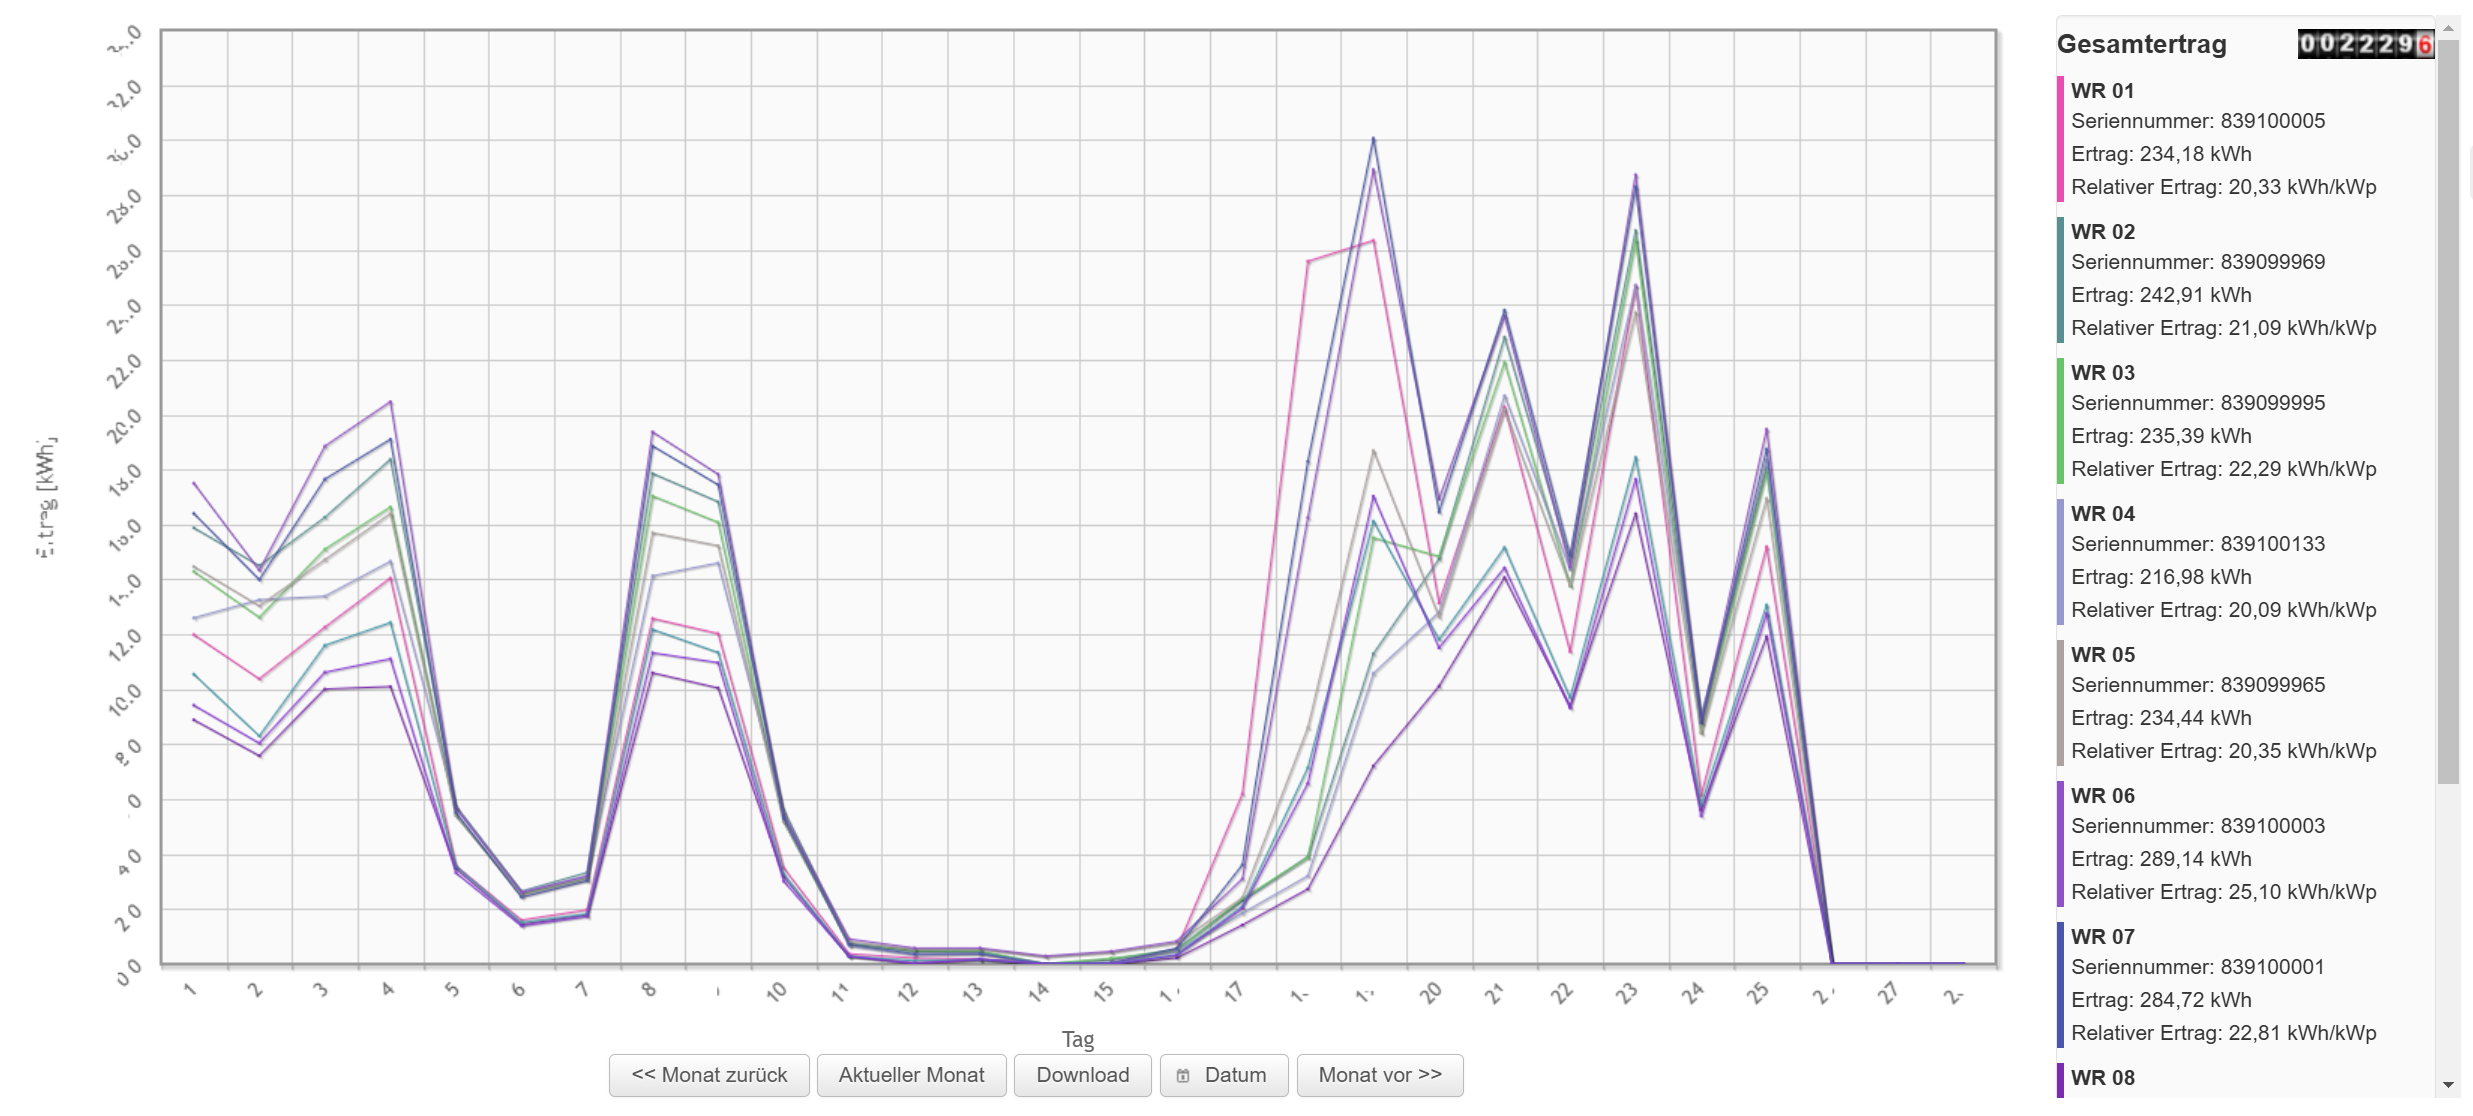
Monthly curve
Line chart of the yields per inverter over one month.
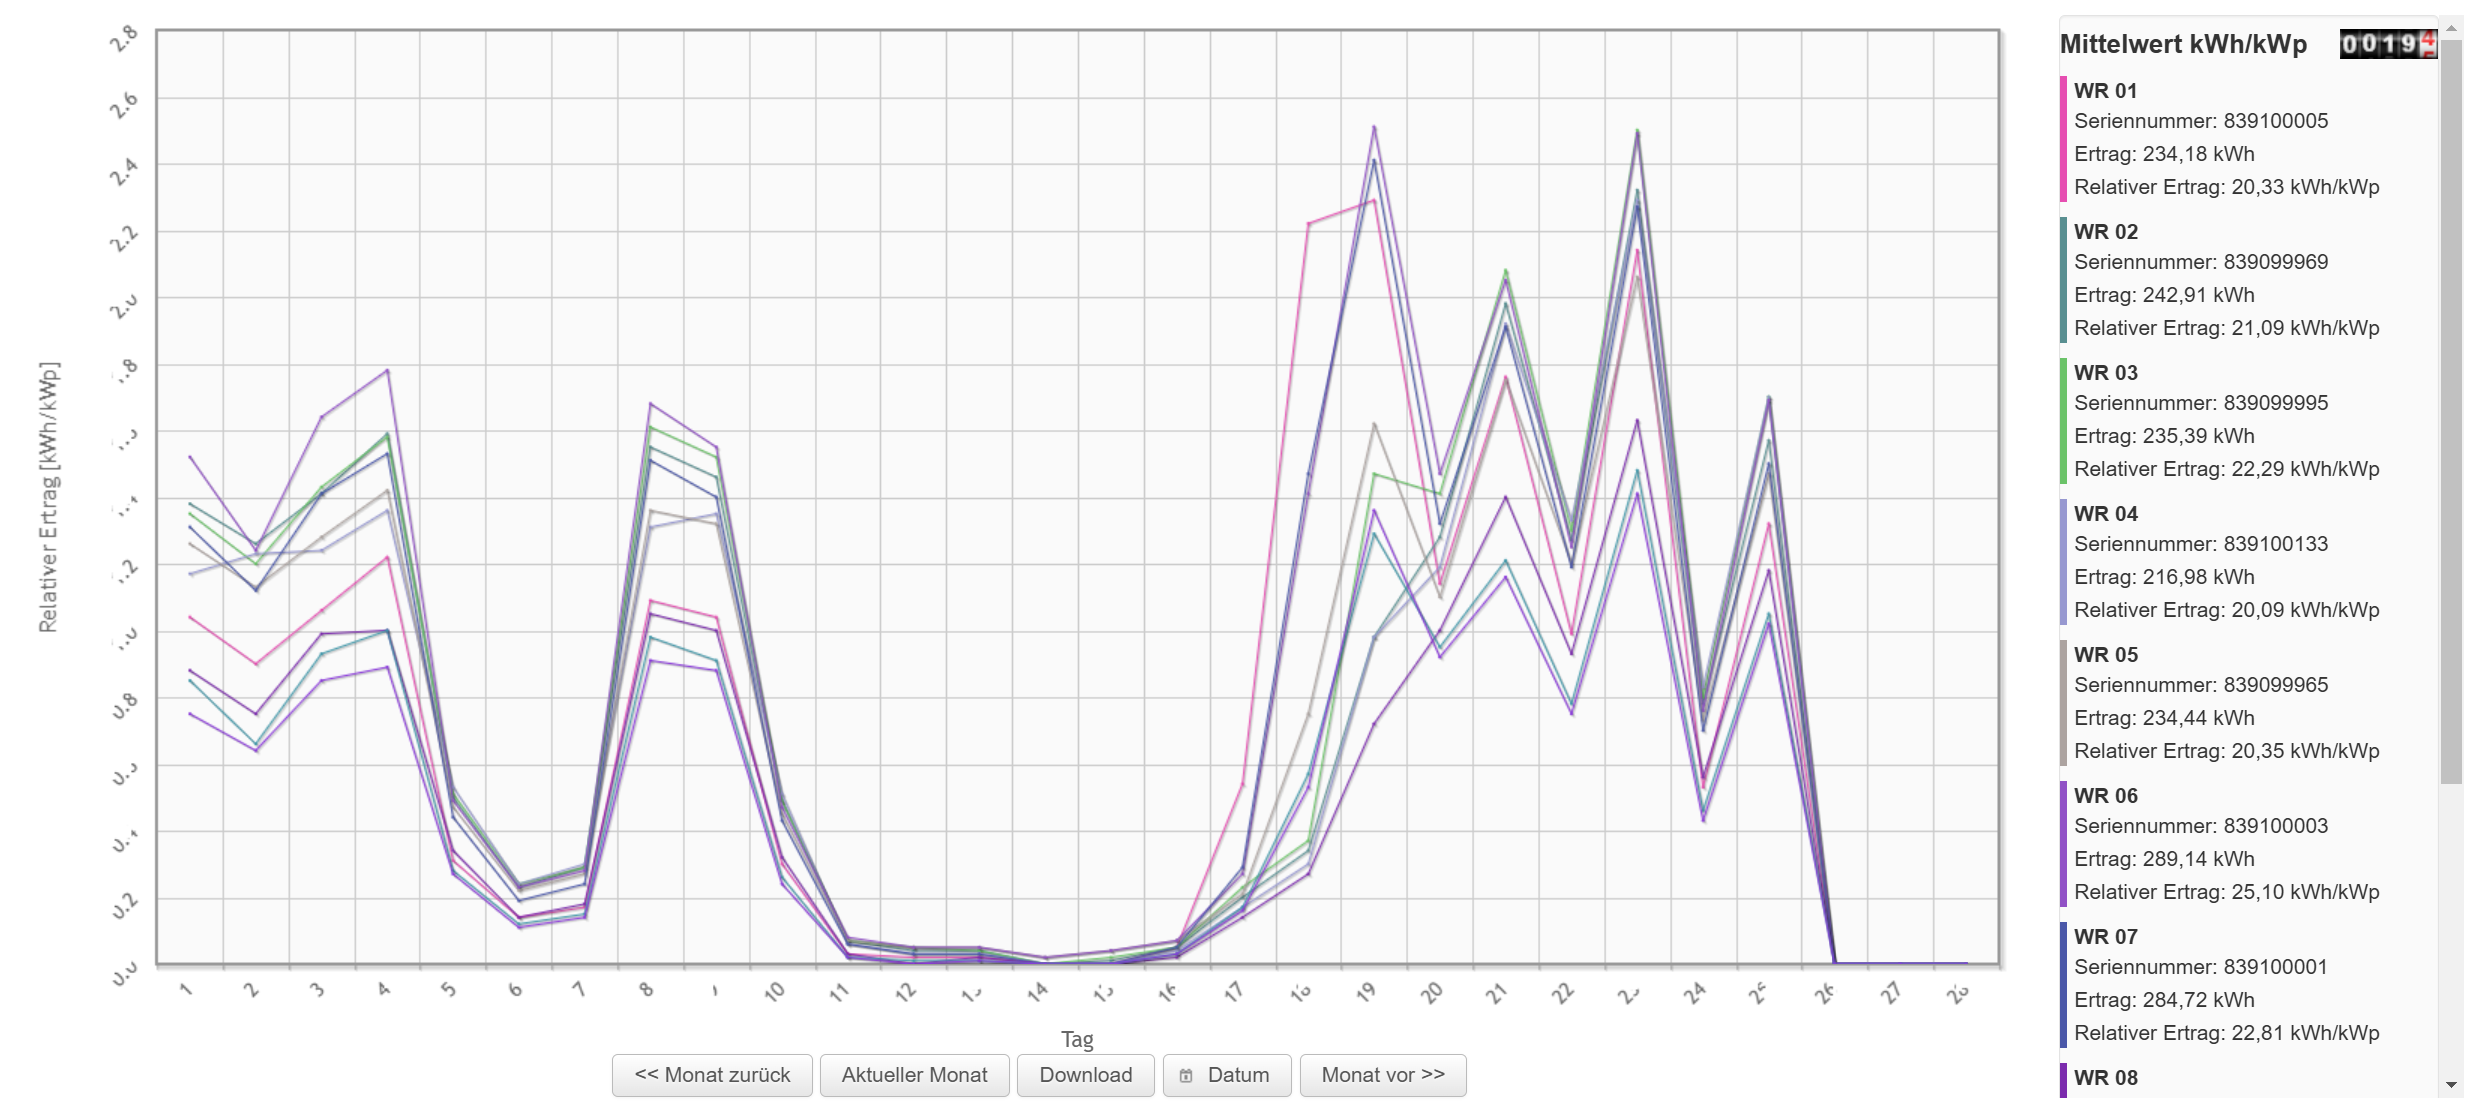
Relative monthly curve
Line chart of the normalised yields per inverter over one month.
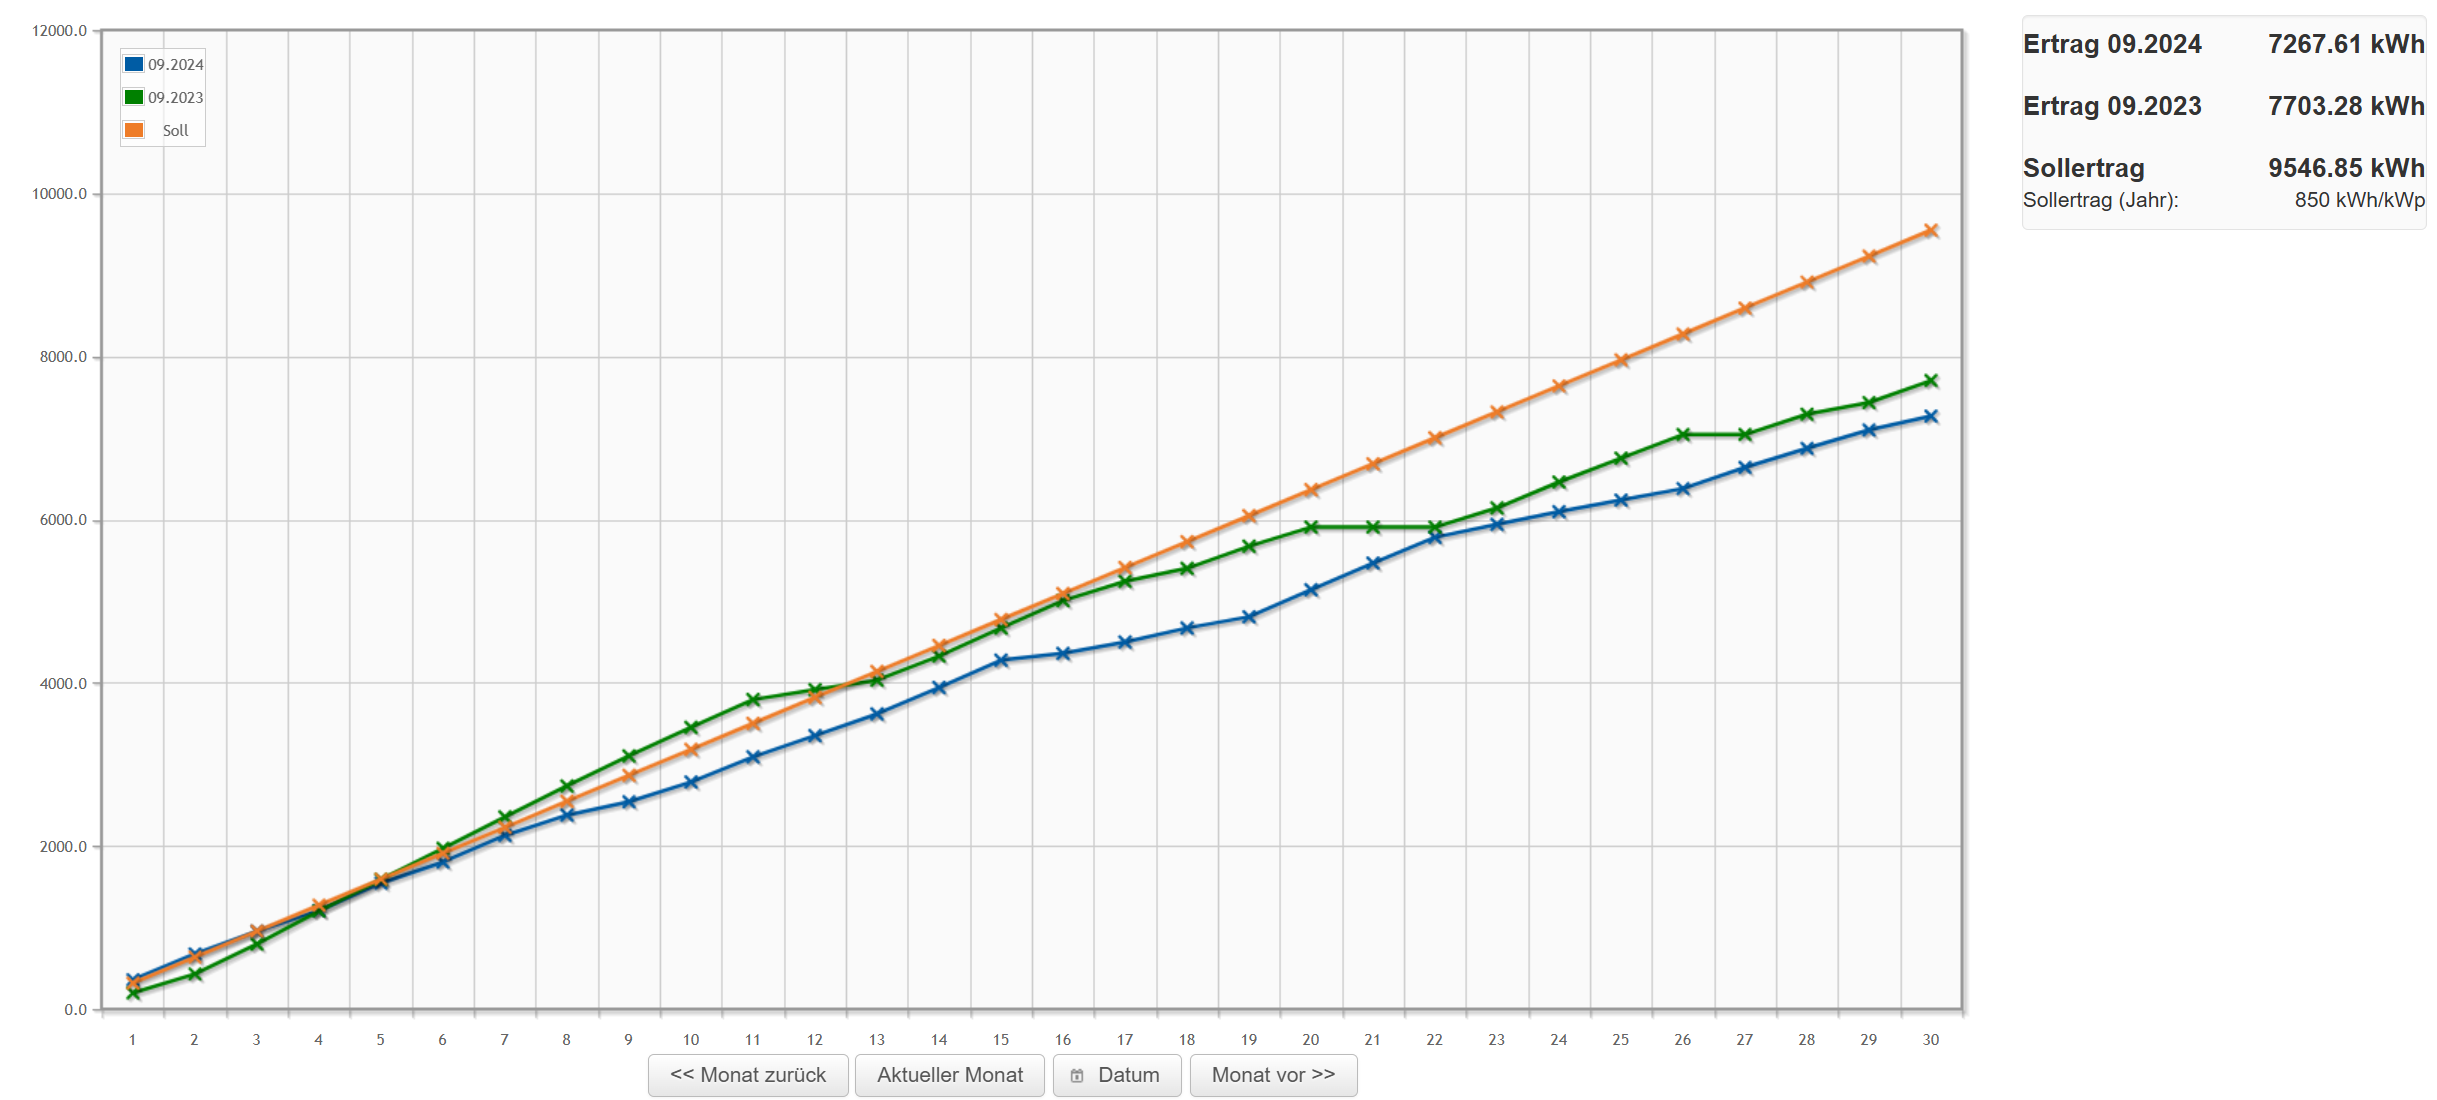
Target/actual comparison
The target/actual comparison compares the yield of the current month and of the same month in the previous year with the target value.
Self-consumption
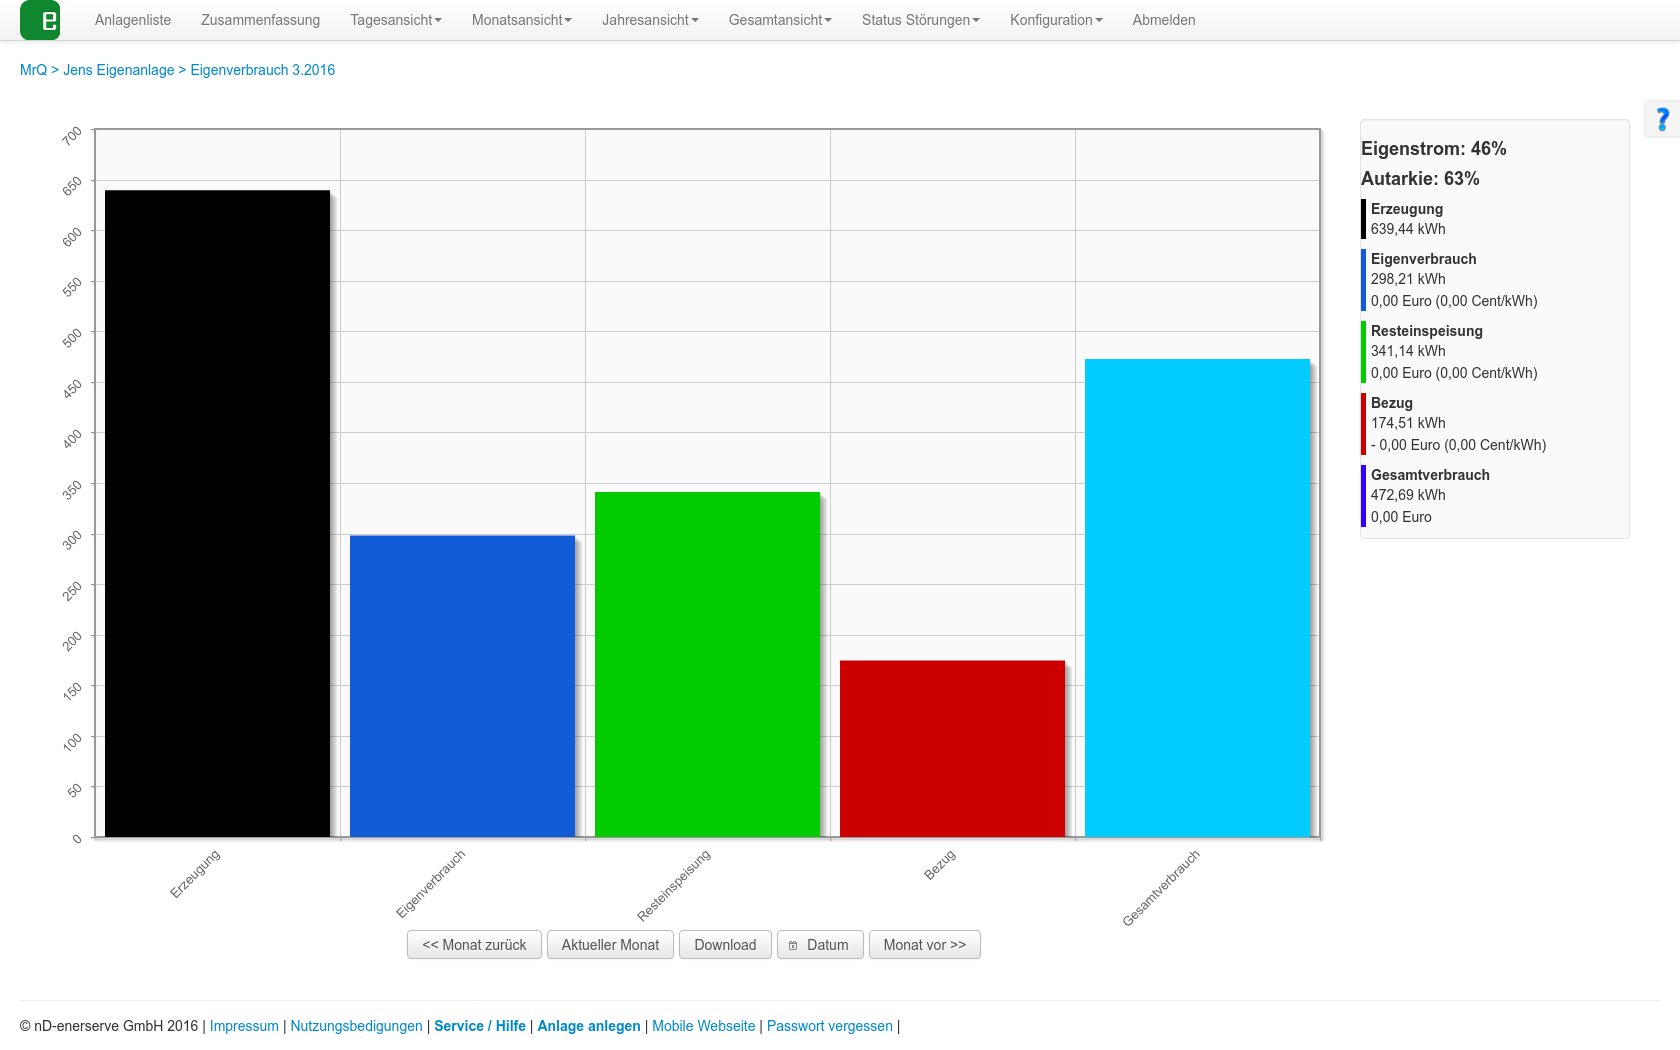
If you have connected a feed-in meter to the e.manager, the yields per month are displayed here.
Generation, grid purchase, feed-in, total consumption, self-consumption
Yearly views
Yearly view
Yield overview of the individual inverters per month.

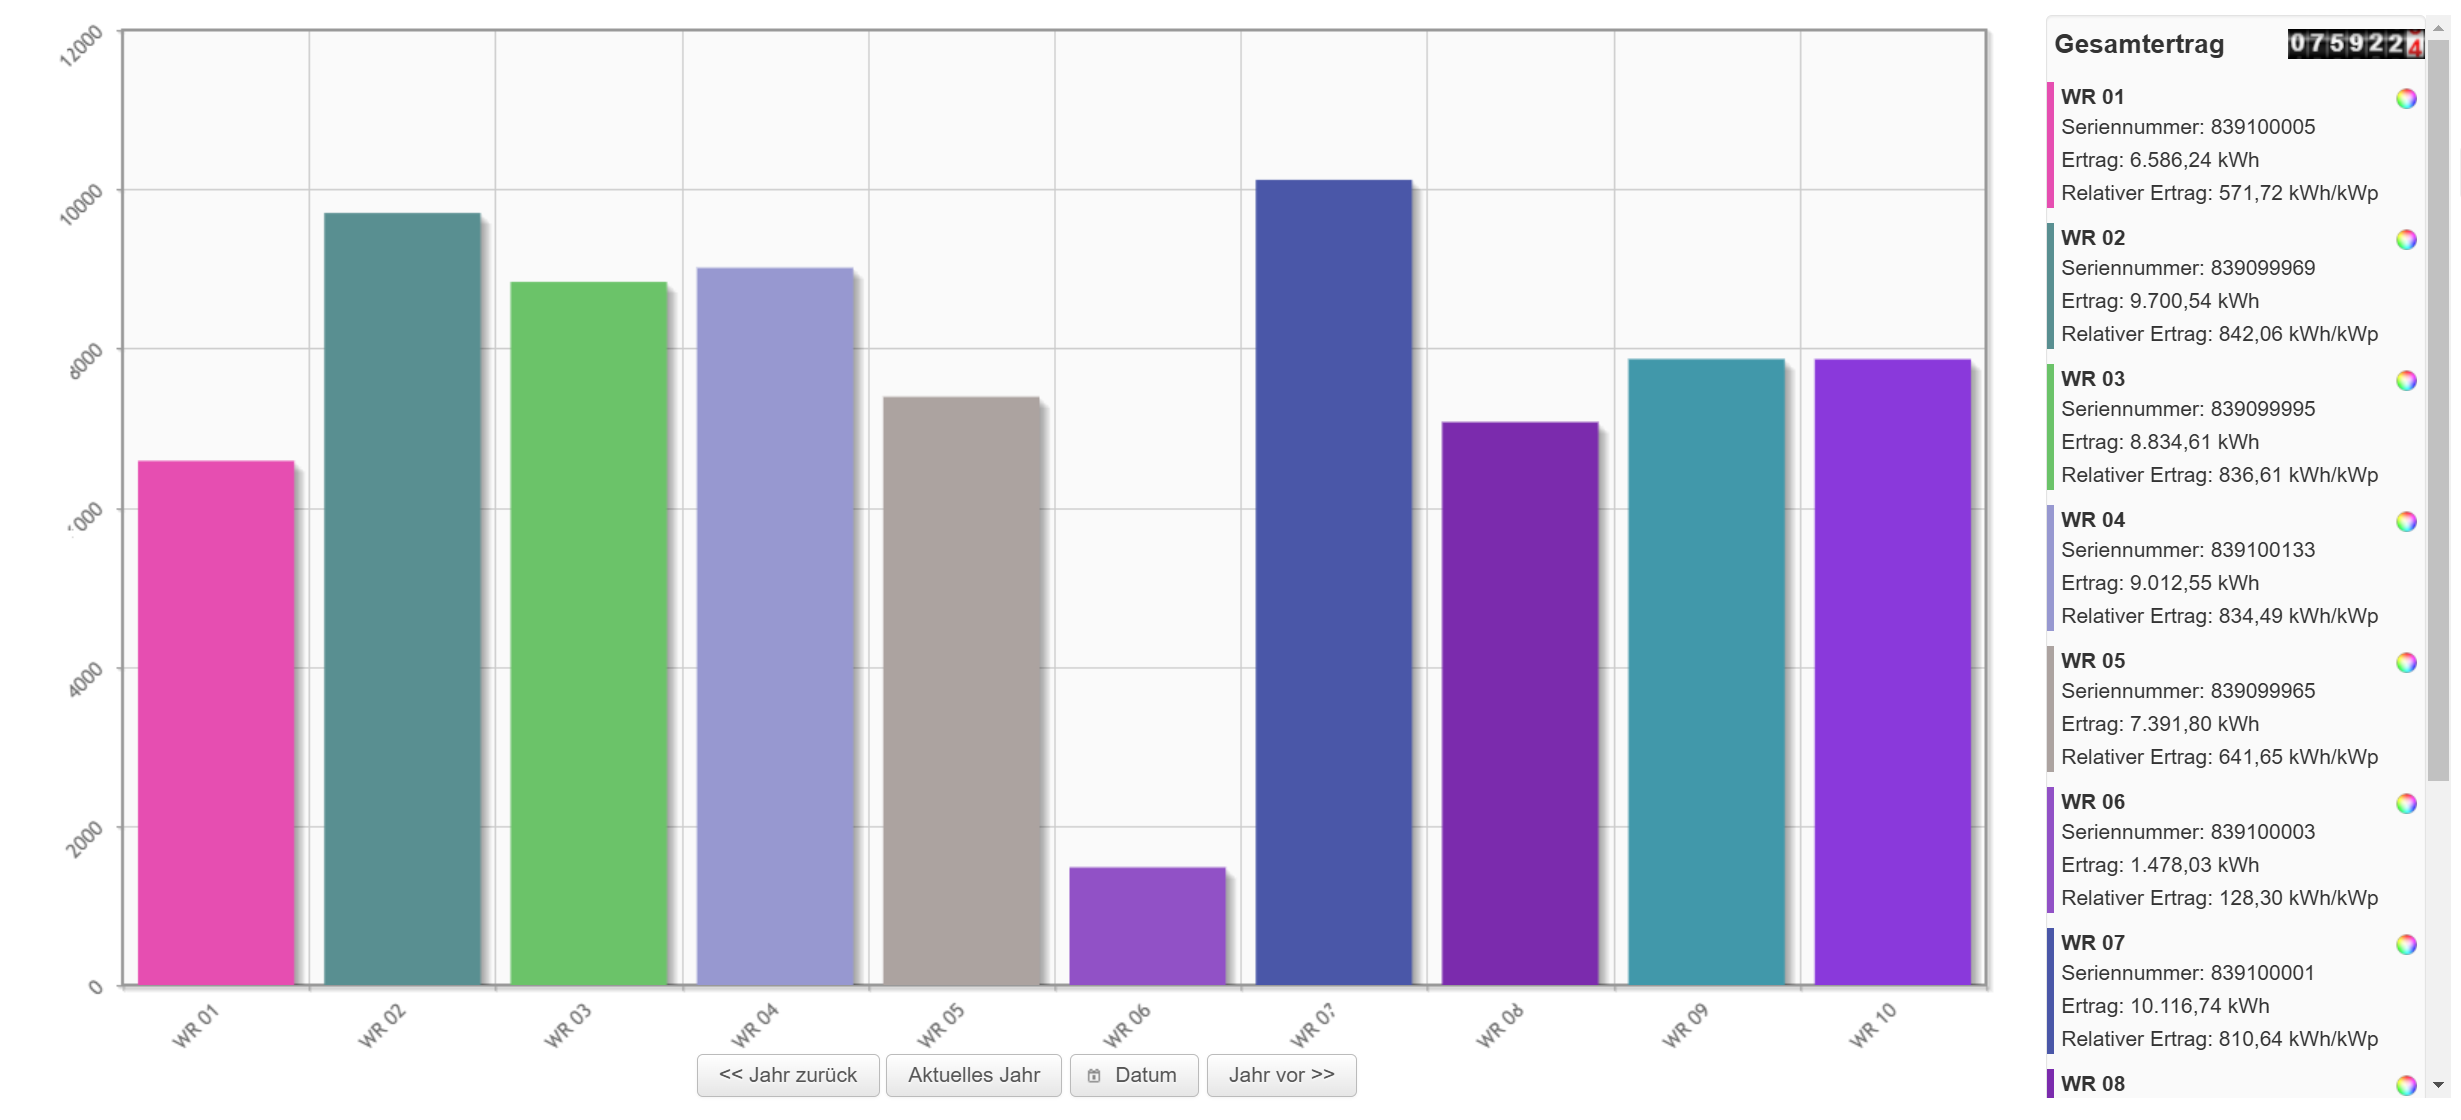
Inverter comparison
Total yield for the year per inverter.
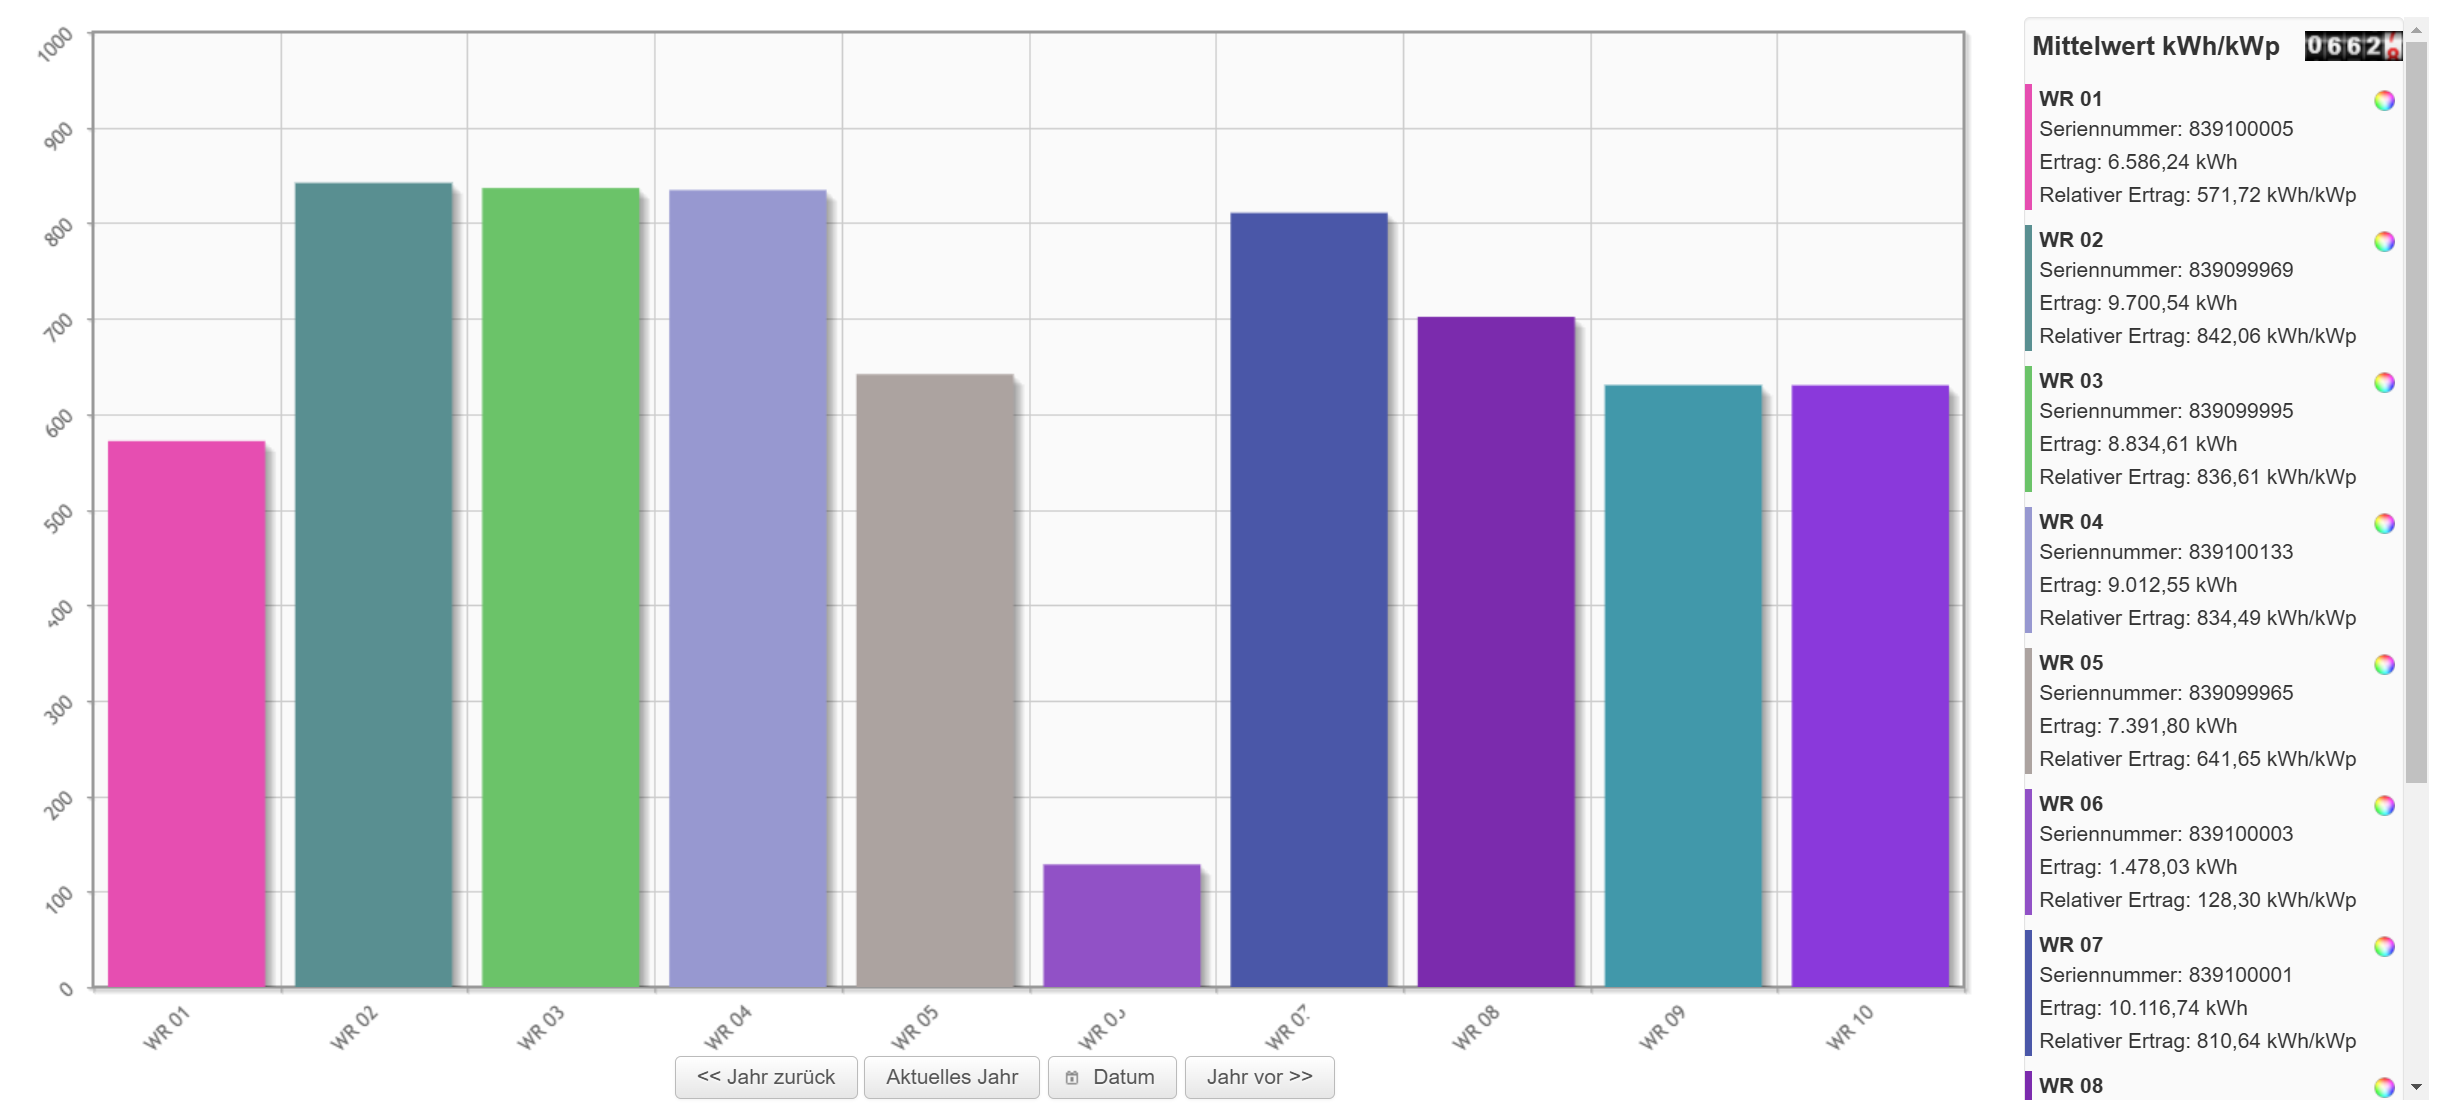
Relative inverter comparison
Normalised yield for the year per inverter.
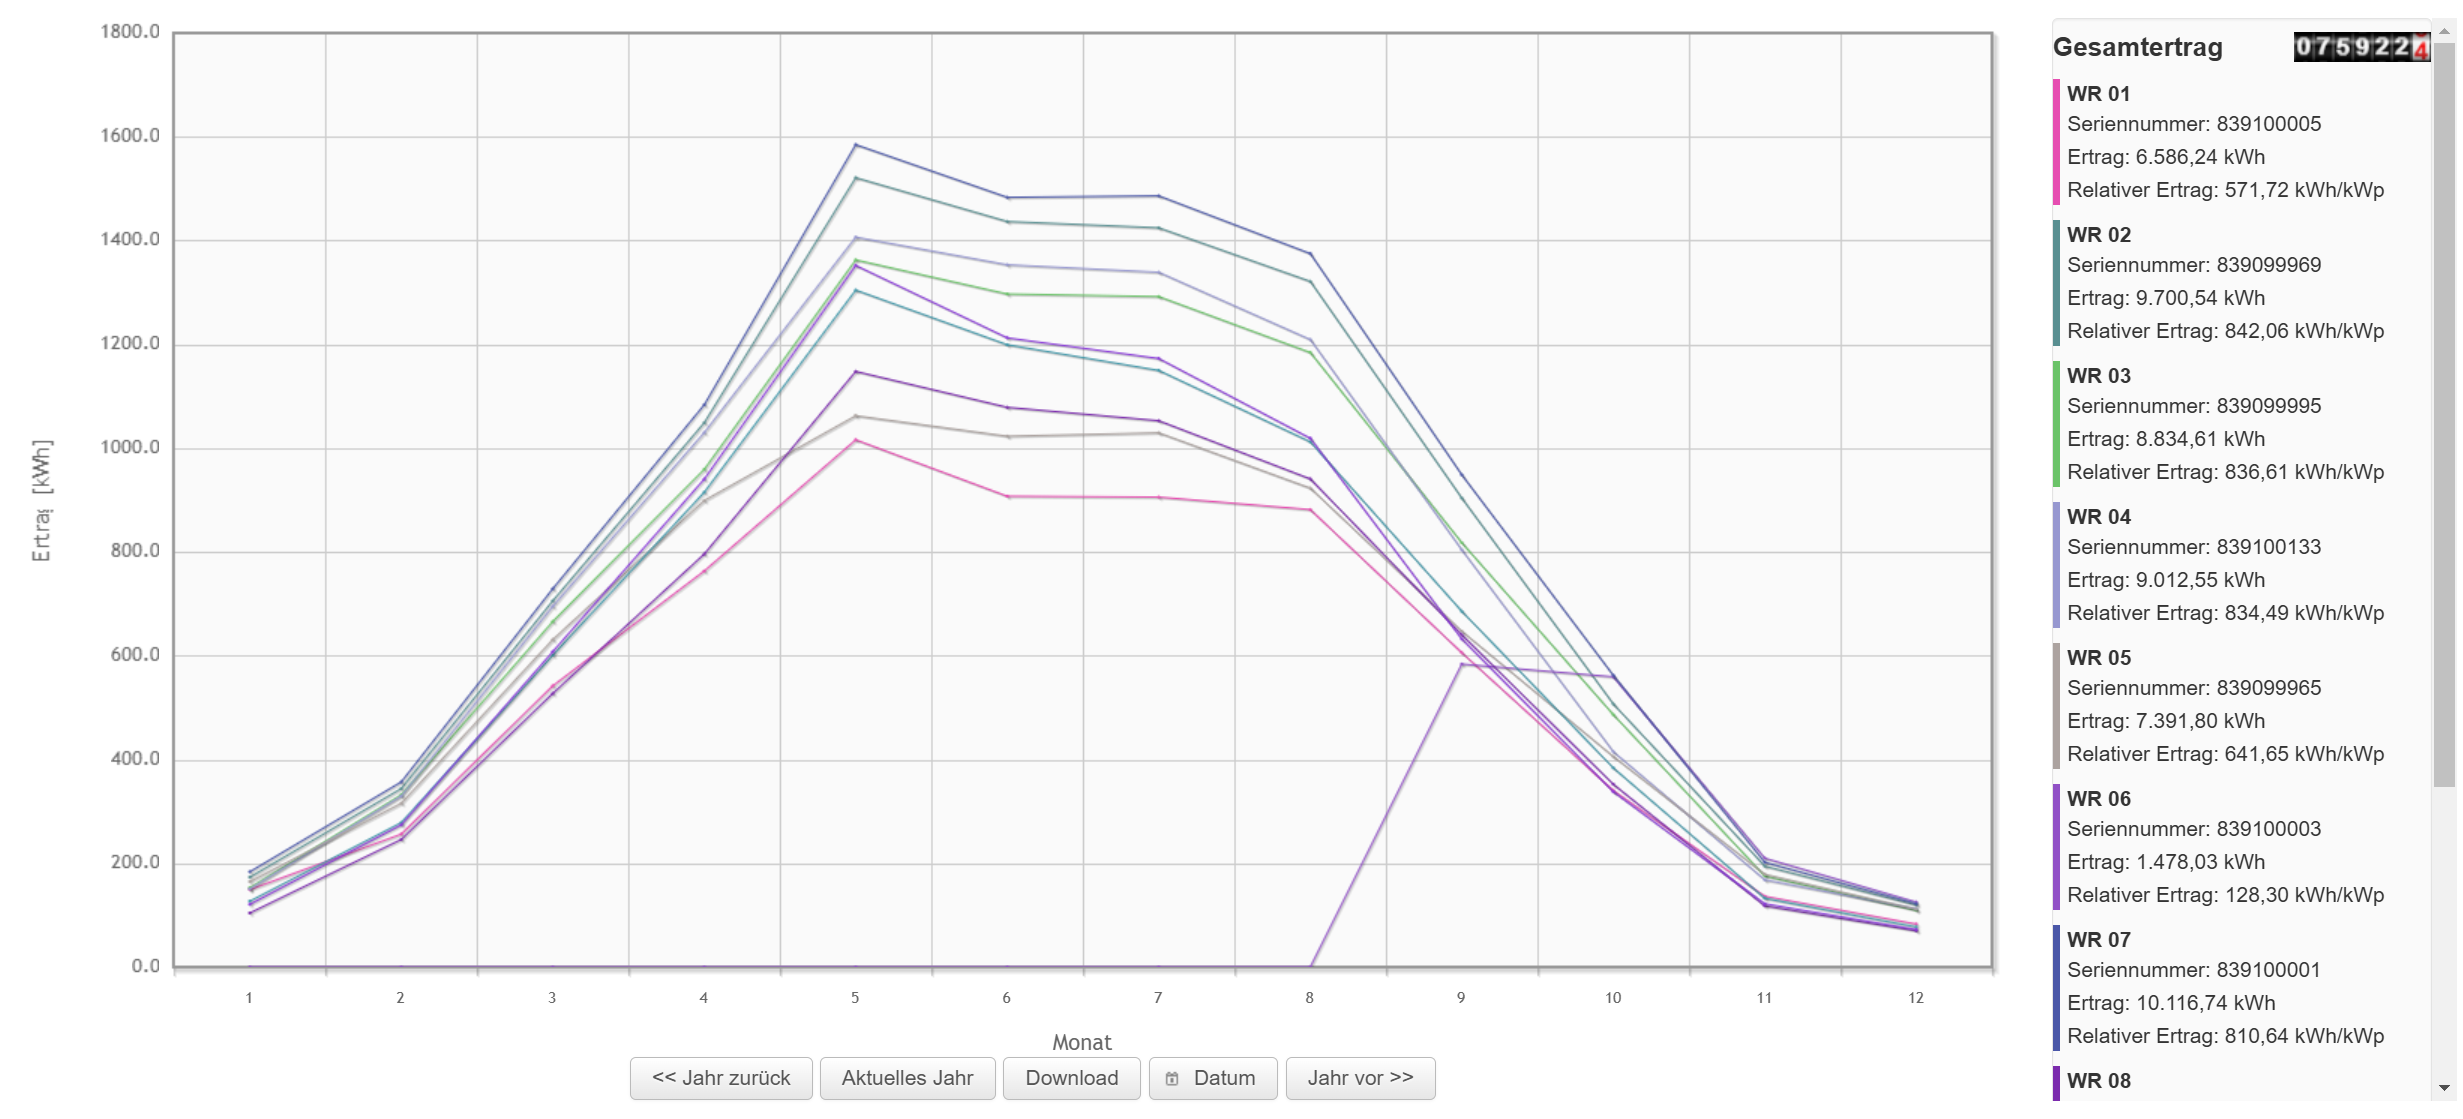
Yearly curve
Line chart of the yields per inverter over one year.
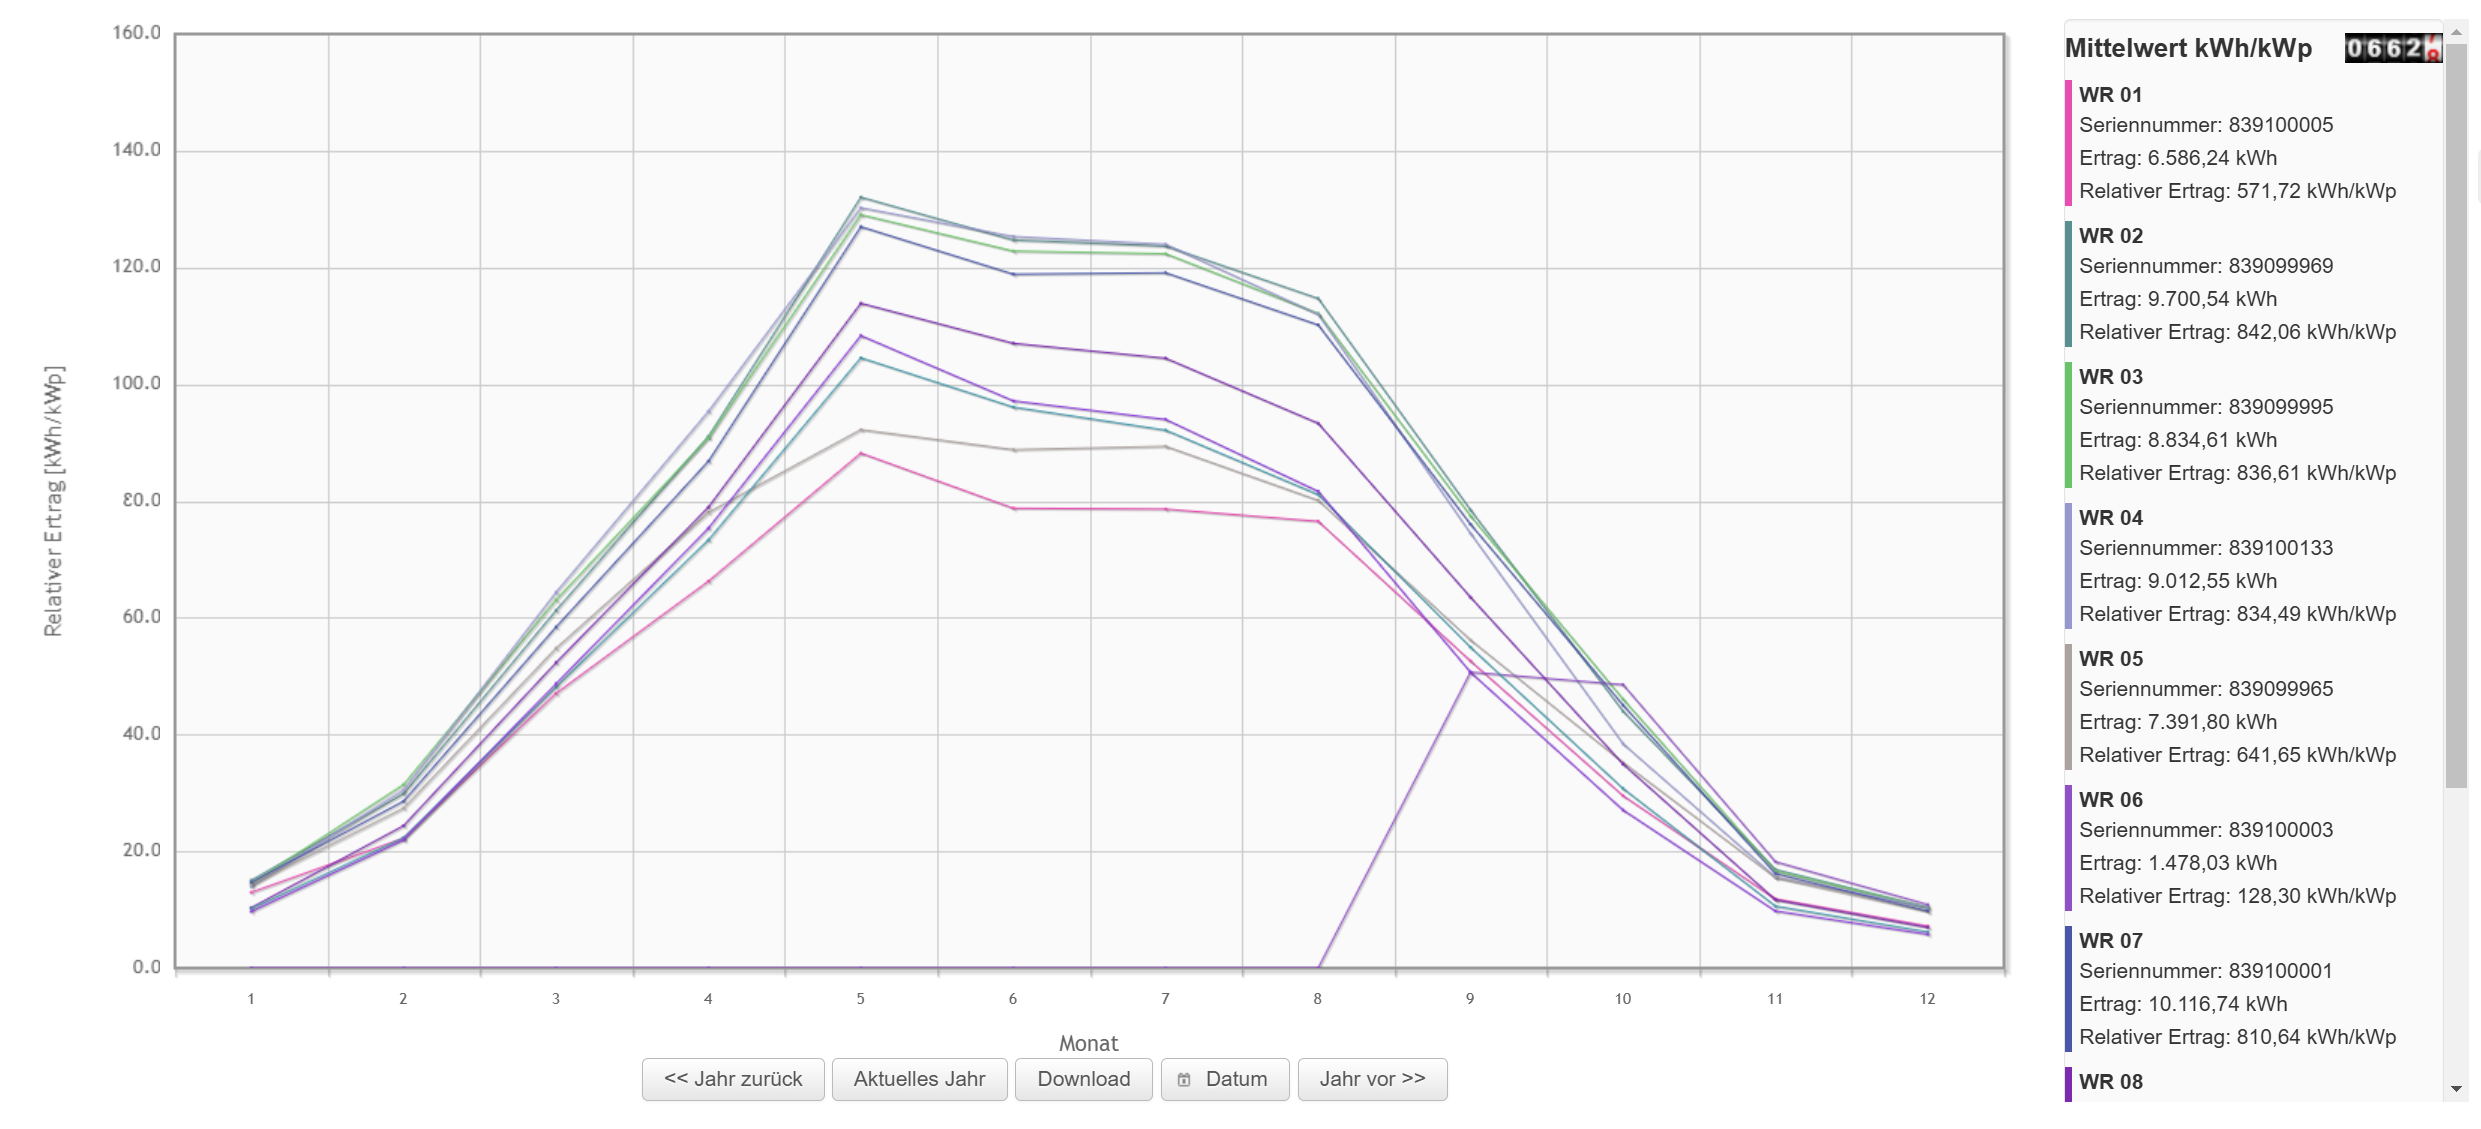
Relative yearly curve
Line chart of the normalised yields per inverter over one year.
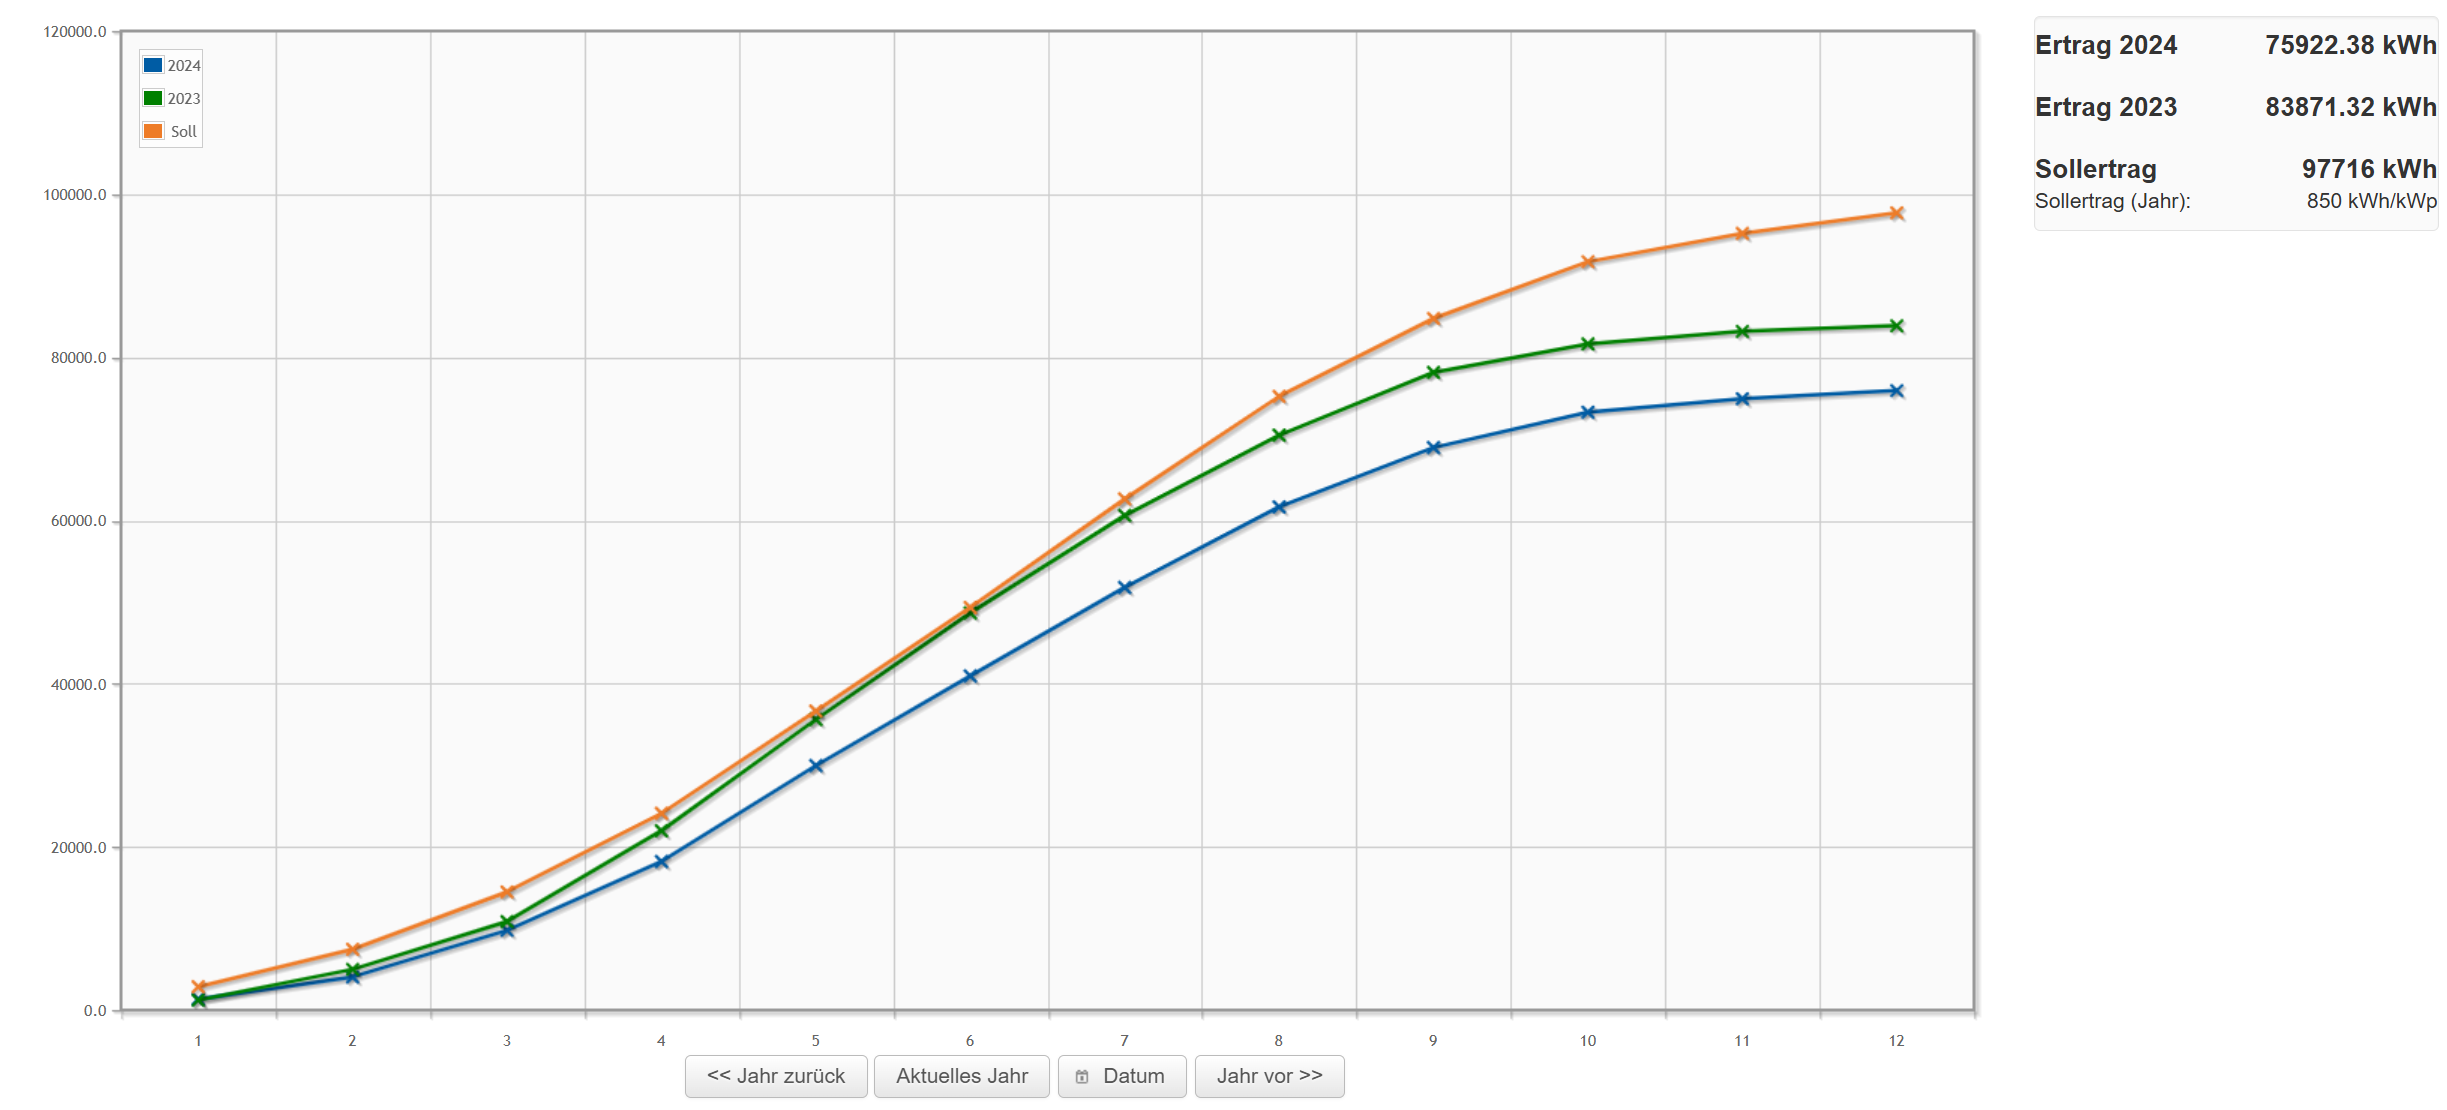
Target/actual comparison
The target/actual comparison compares the yield of the current year and of the previous year with the target value.
Total views
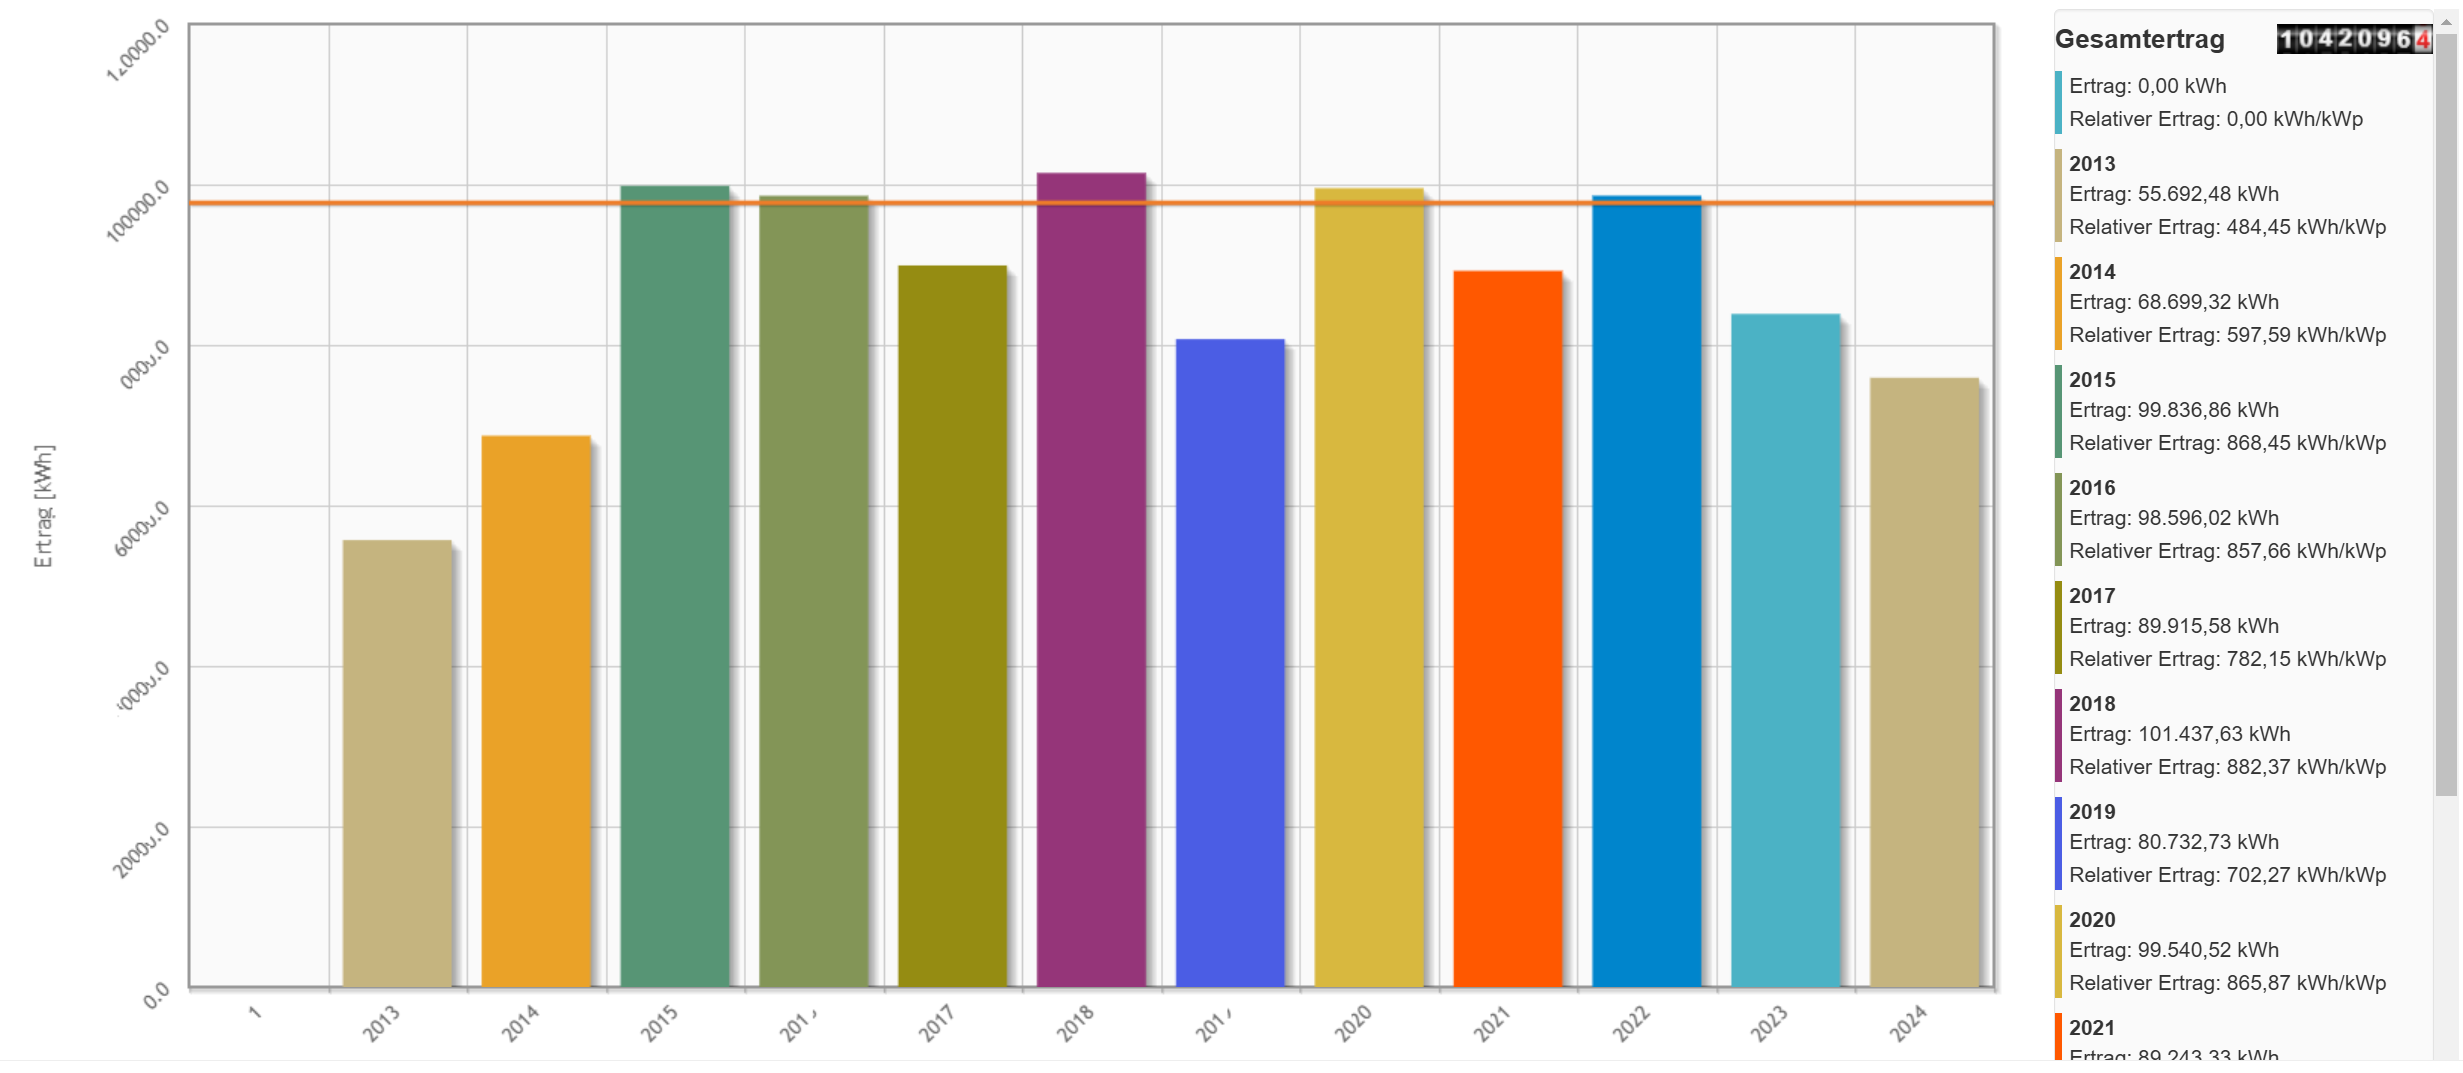
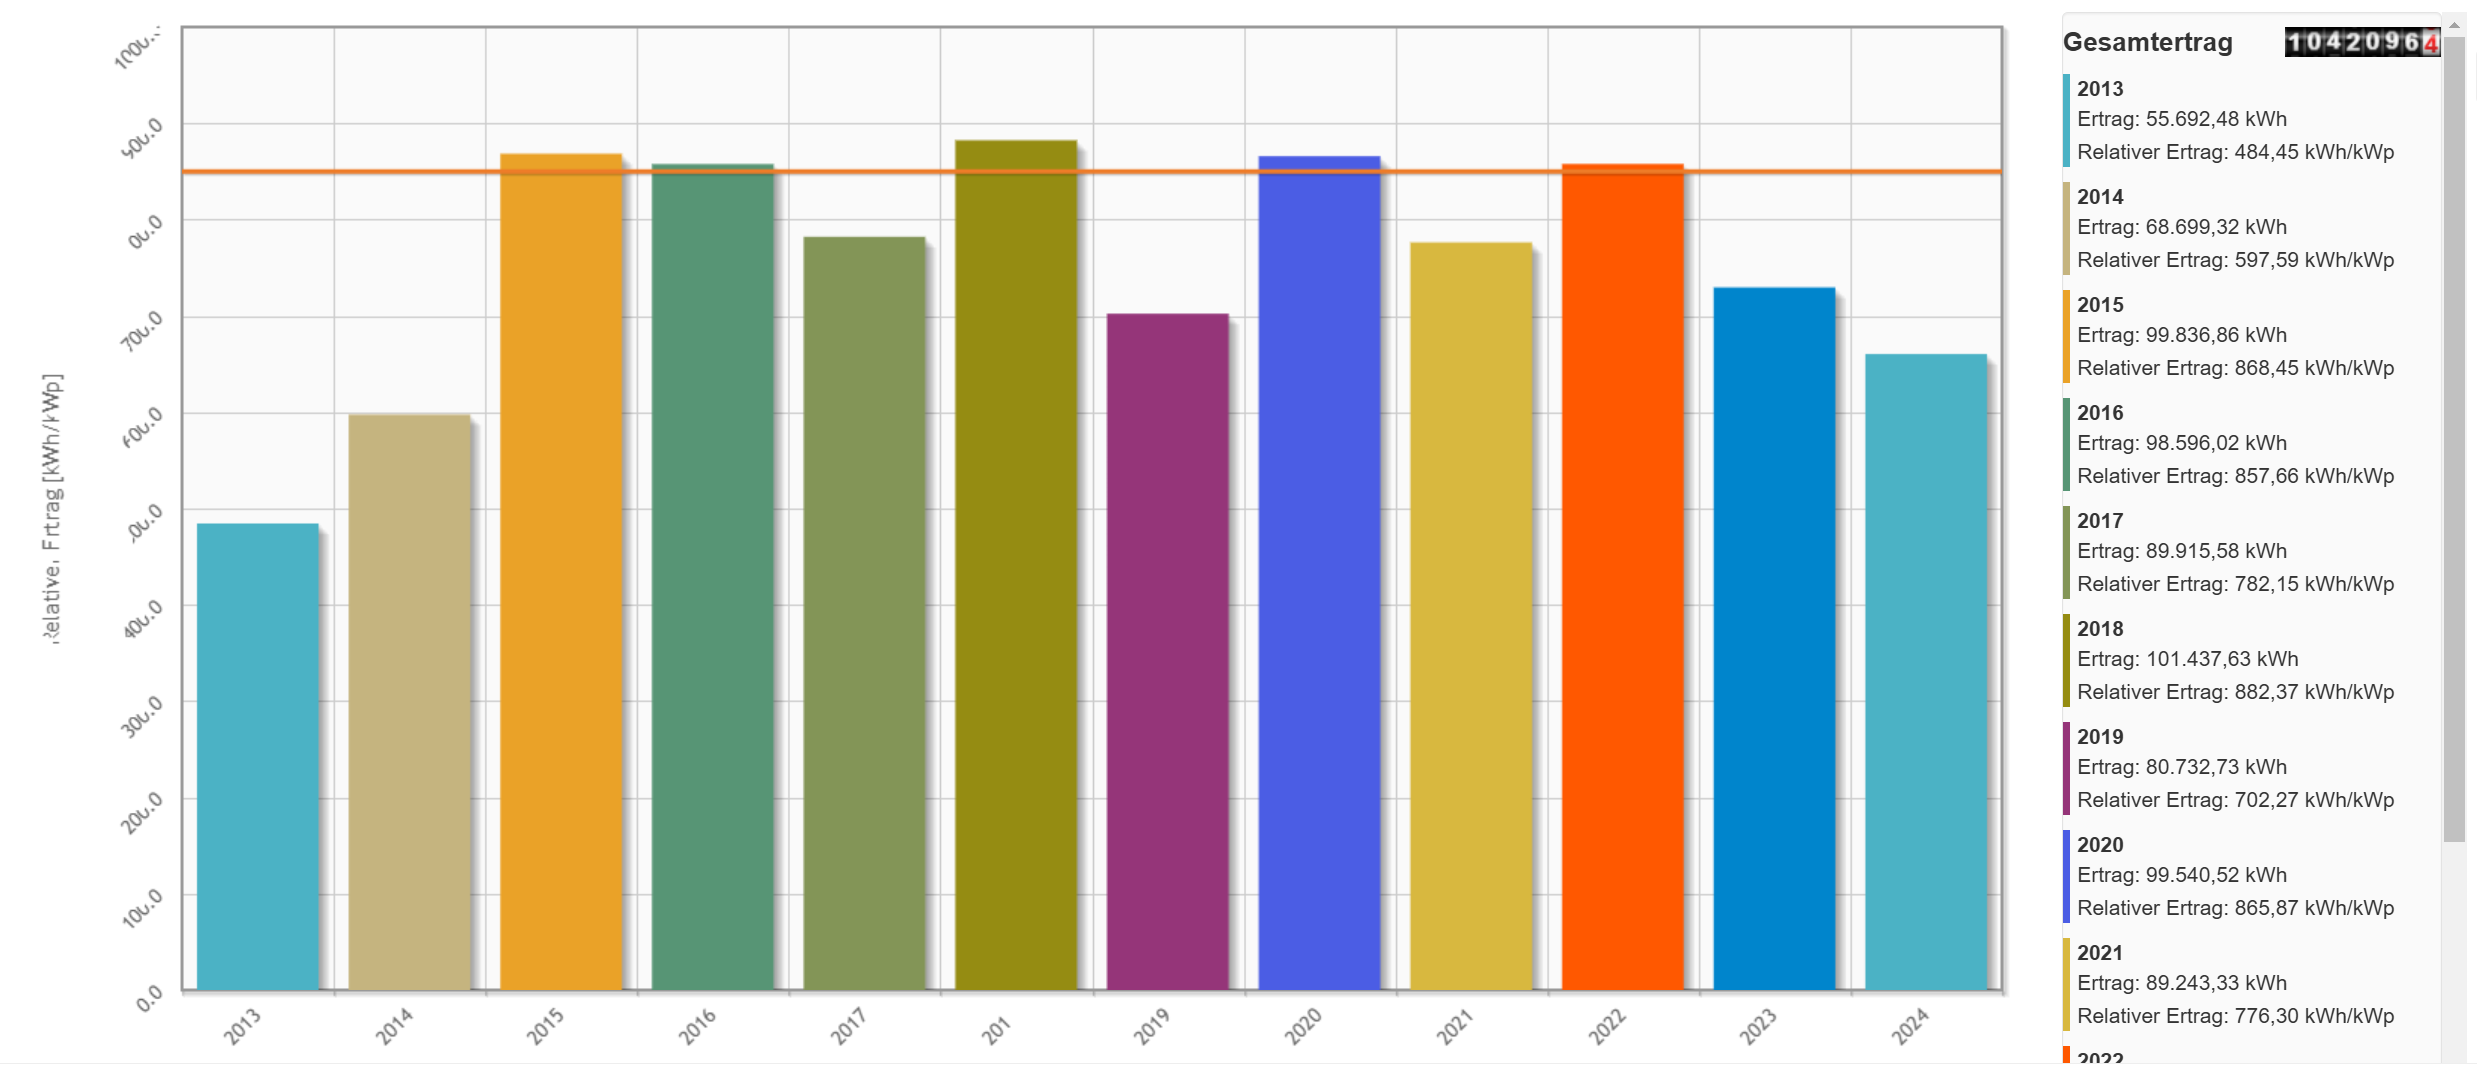
Total view
Total yield of the years per inverter.
Relative total view
Normalised yield of the years per inverter.
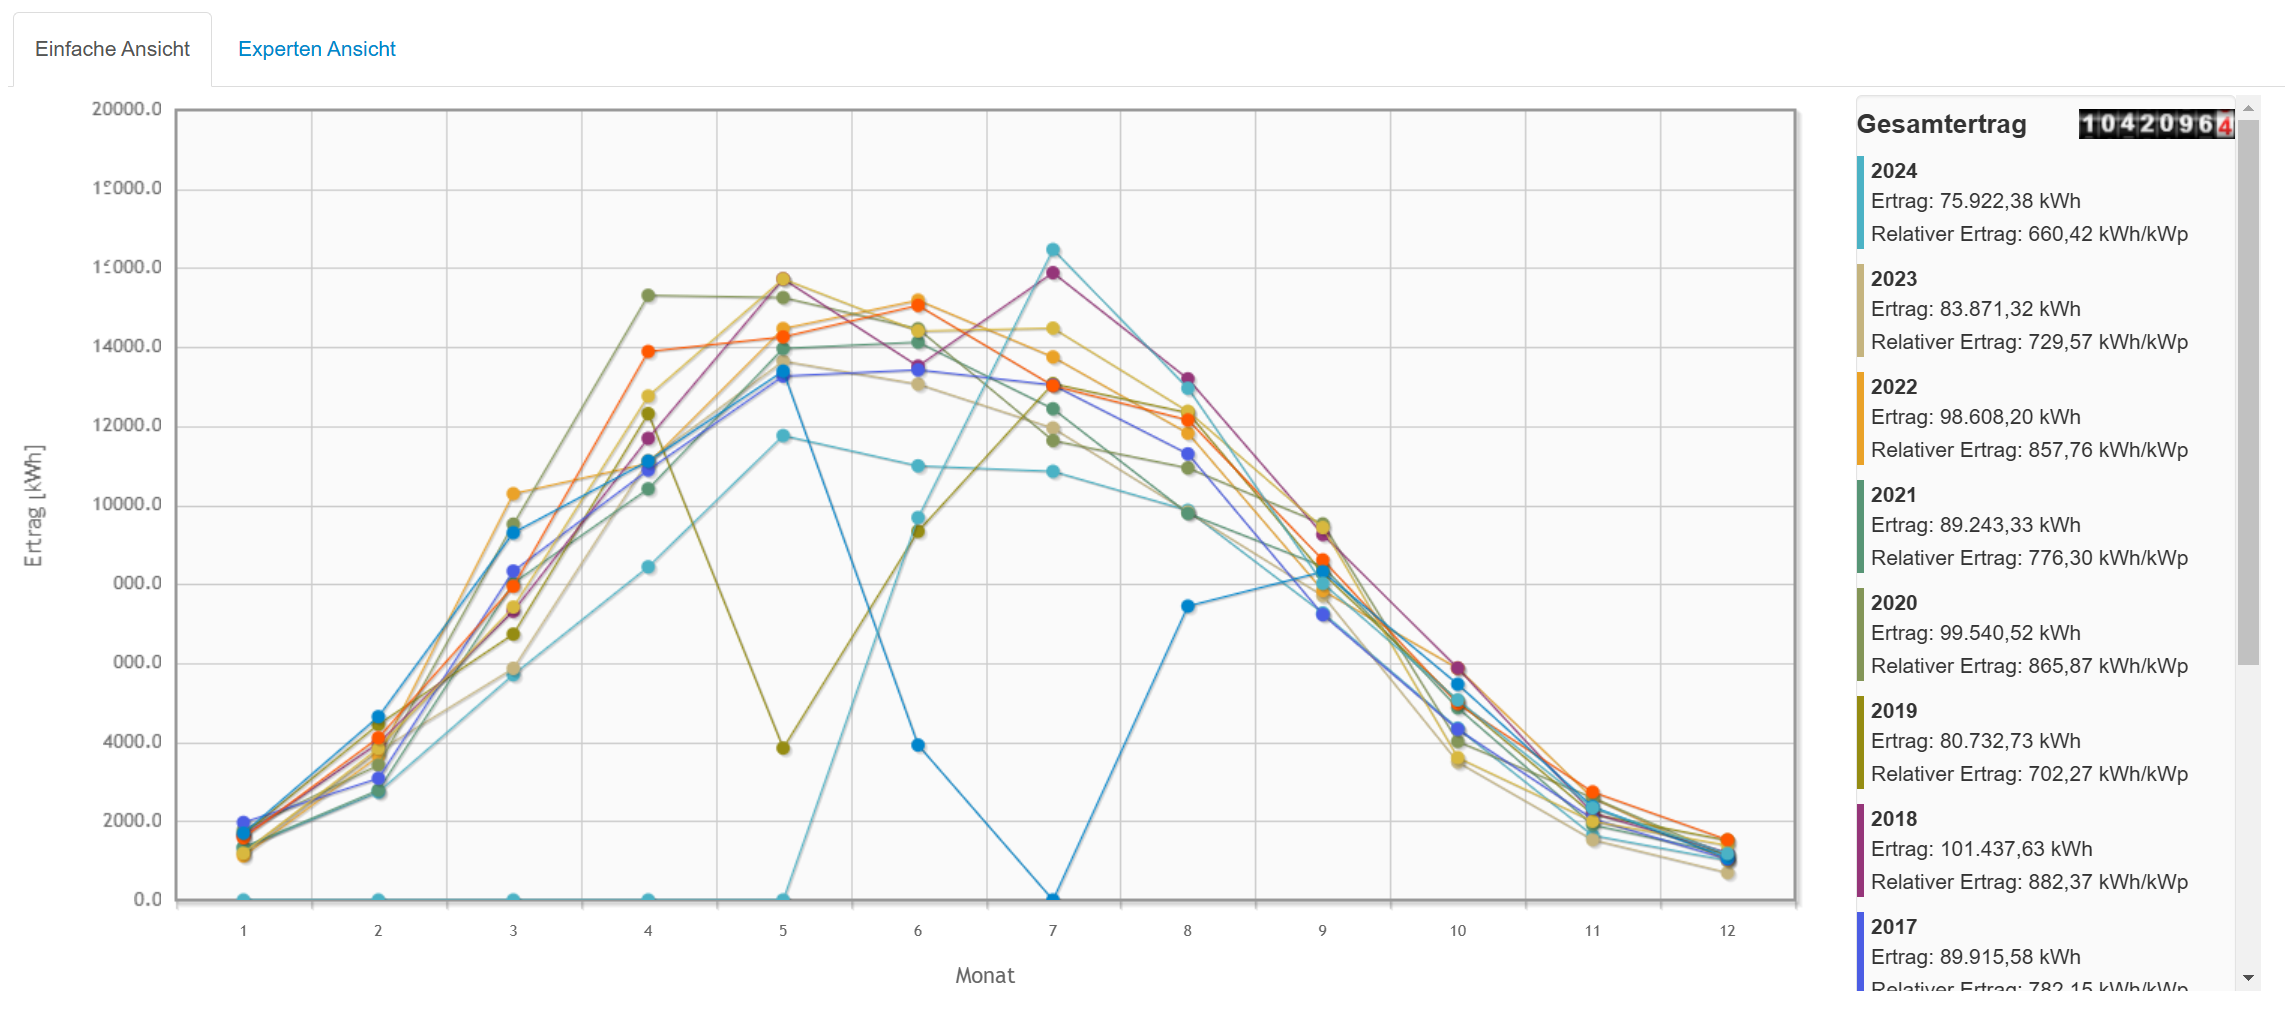
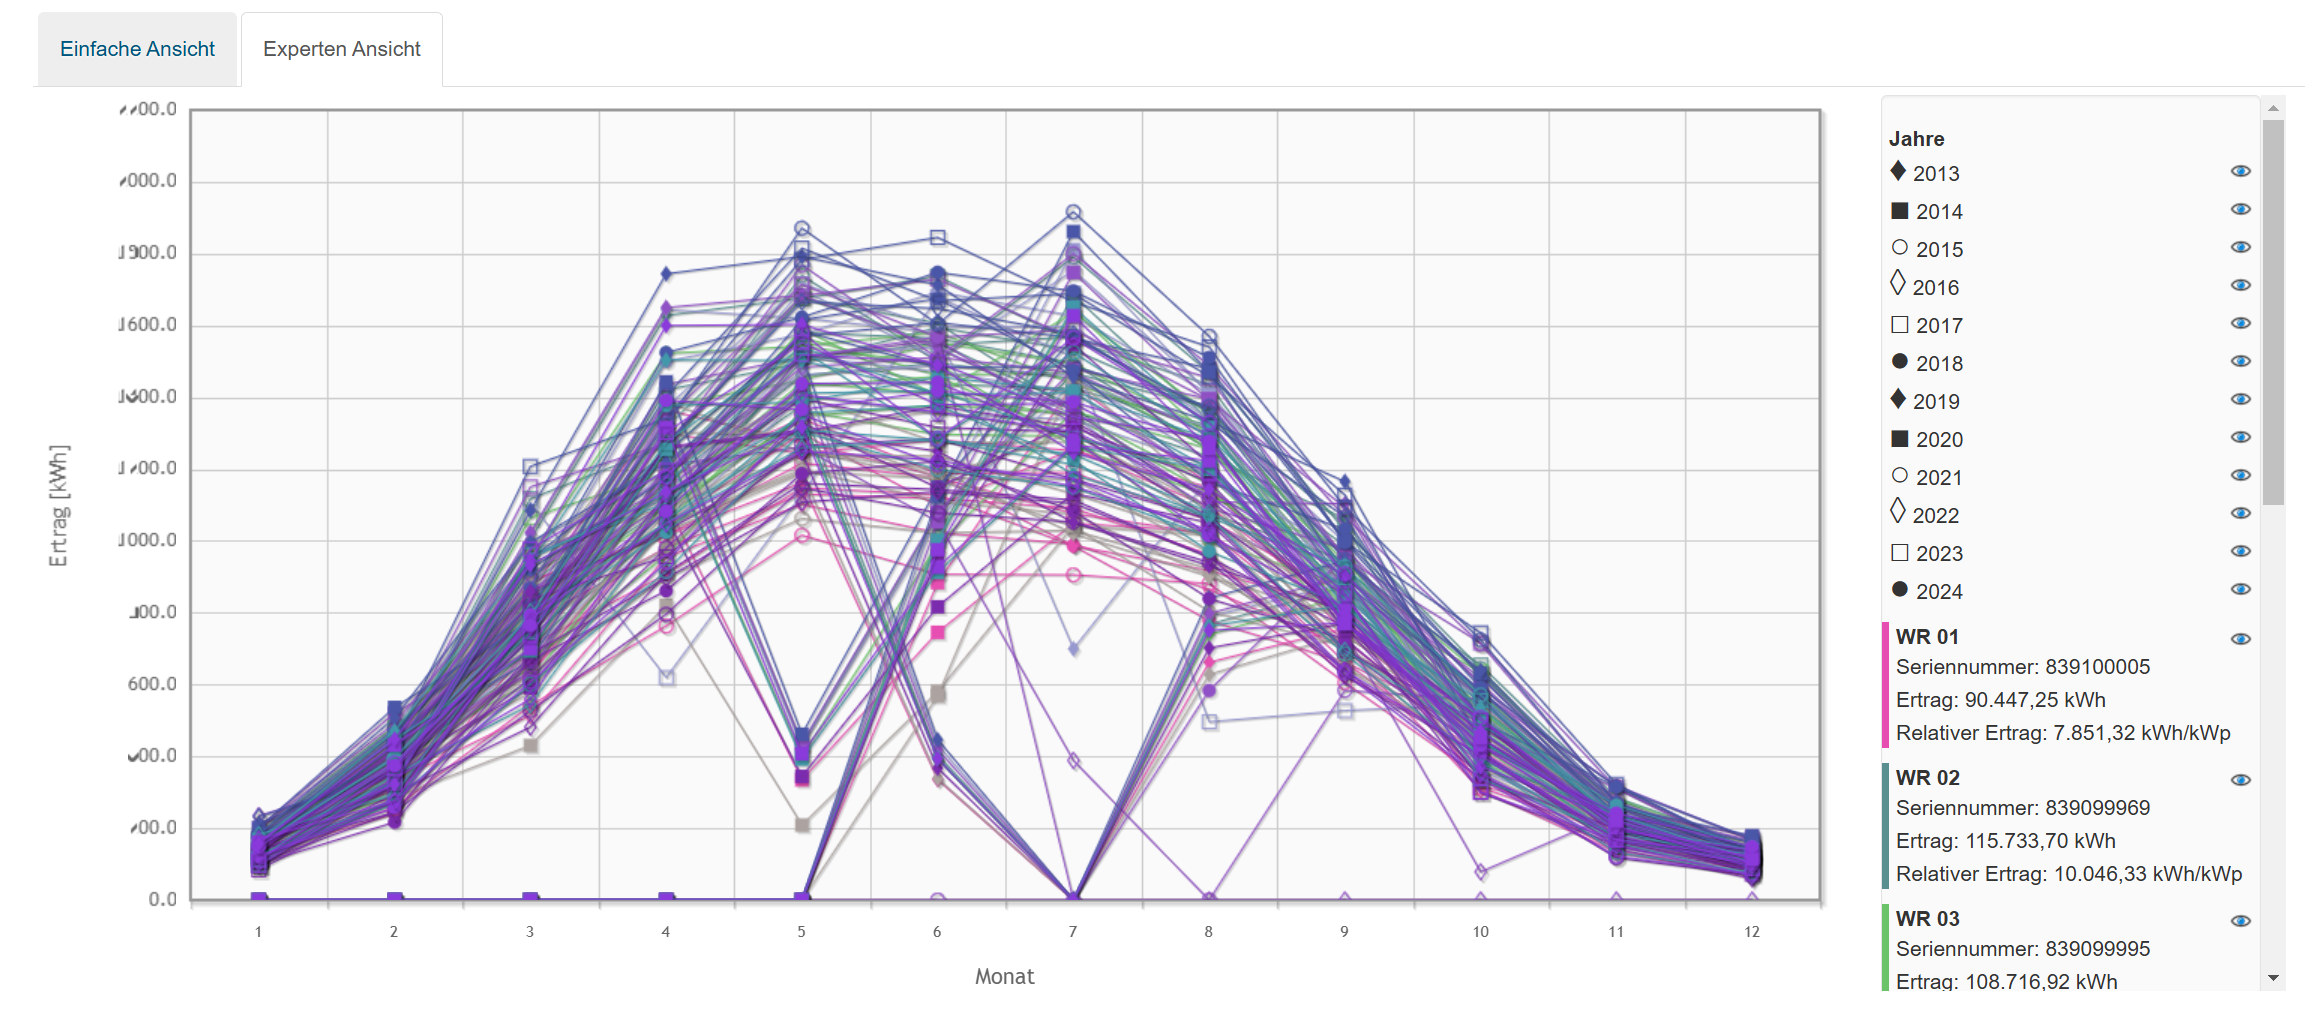
Overall curve
The overall curve shows the total of all inverters per year and per month.
Expert view: Instead of the total of all inverters, each inverter is shown individually here. You can hide individual inverters or years.
Note: with many inverters, the chart can quickly become cluttered.
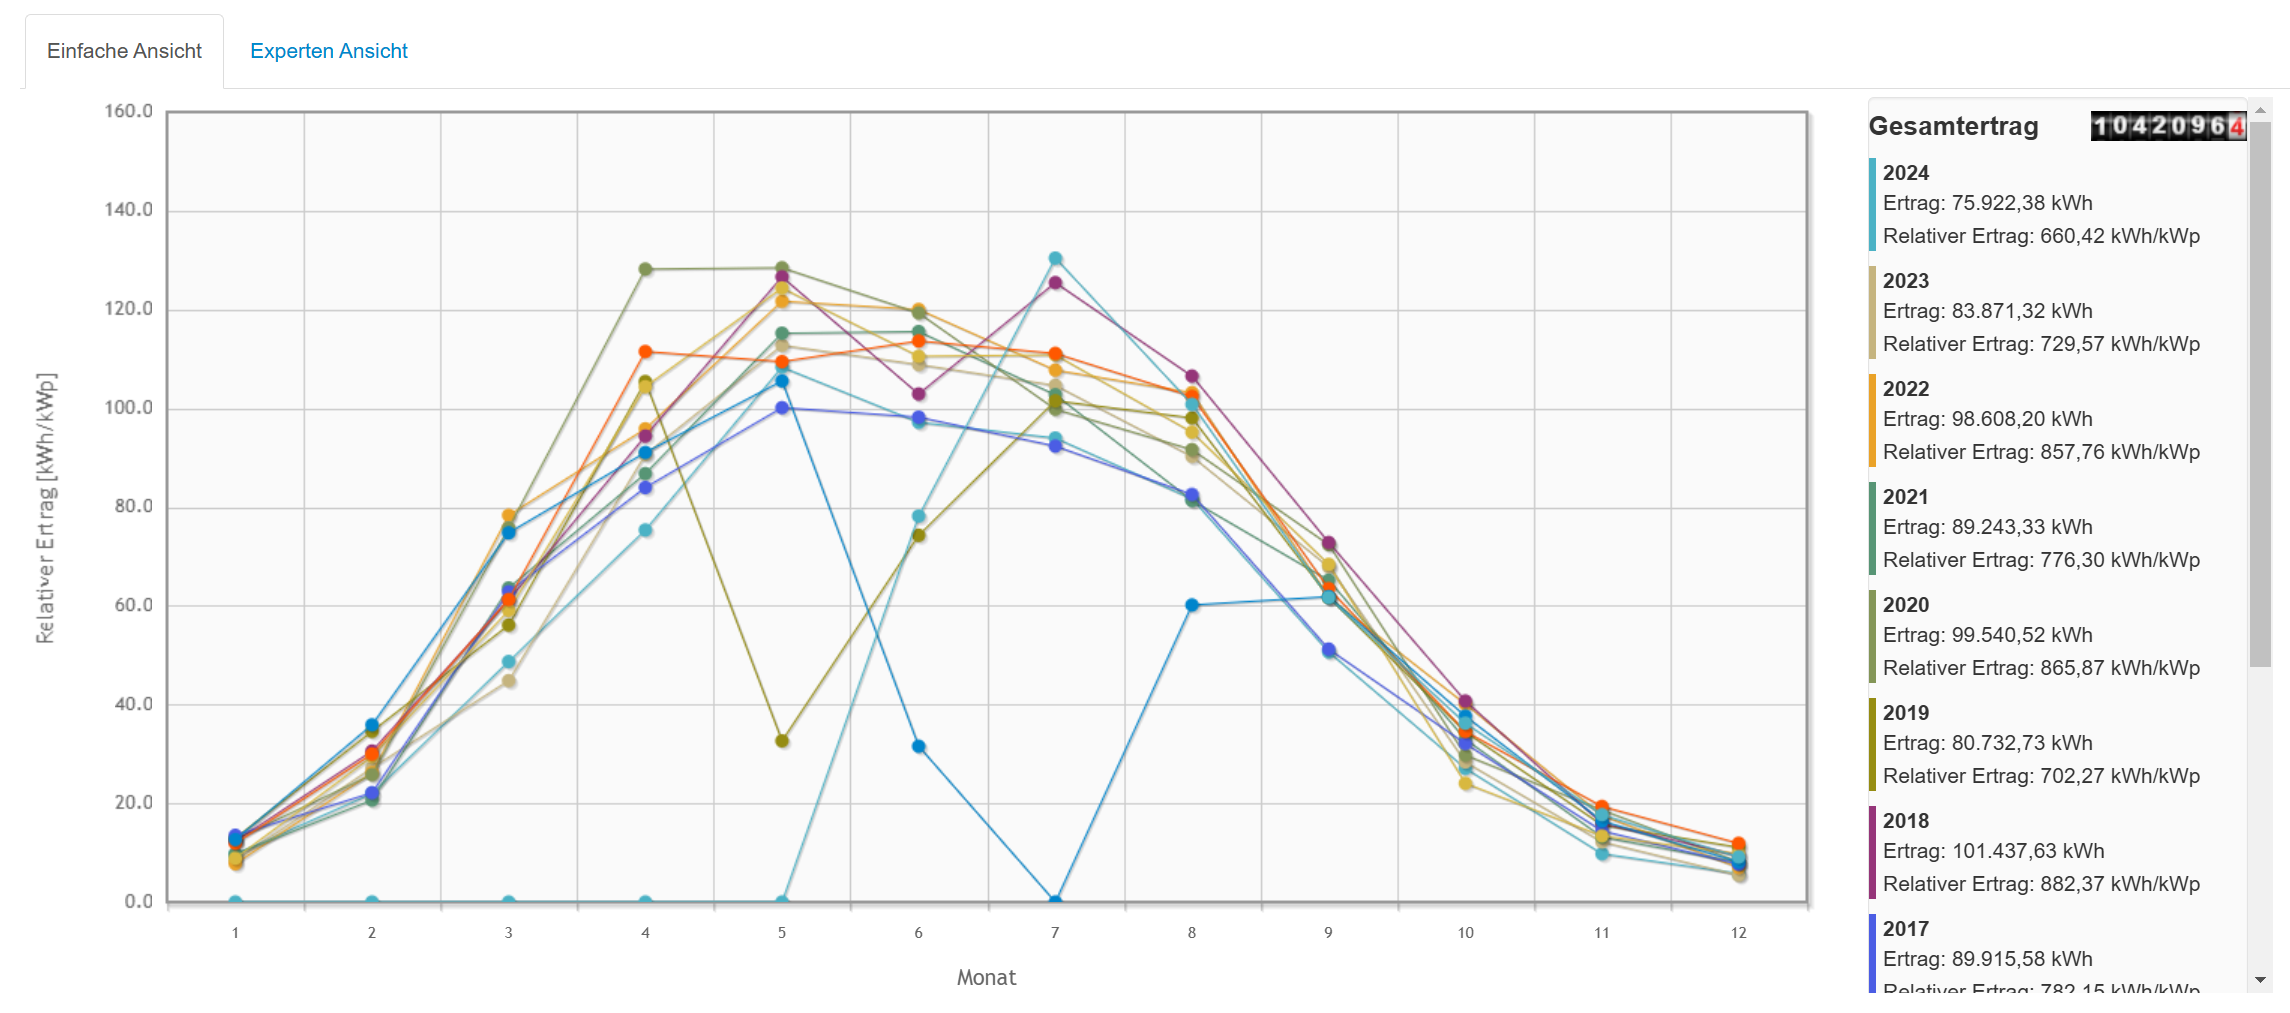
Relative overall curve
The relative overall curve shows the normalised total of all inverters per year and per month.
Expert view:
Instead of the total of all inverters, each inverter is shown individually here. You can hide individual inverters or years.
Note: with many inverters, the chart can quickly become cluttered.