



If you operate a PV system subject to the 70% feed-in limit (the German rule capping grid feed-in at 70% of installed PV capacity), you can use this function to dynamically readjust the inverters and further increase self-consumption by switching on loads.
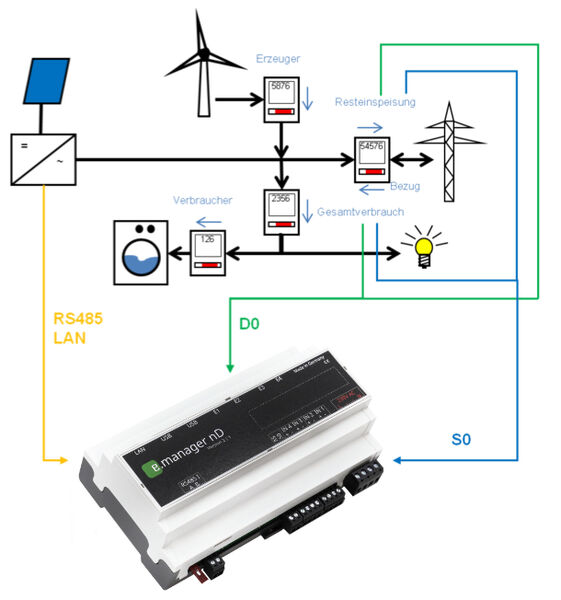
Installation
(PV output – total consumption) = residual feed-in
Fail-safety
Residual feed-in via S0: not fail-safe
Residual feed-in via RS485 or LAN: fail-safe (if the meter fails, the inverters are limited across the board to 70%)
Total consumption meter via S0: fail-safe (if the meter fails, the inverters are limited across the board to 70%)
Total consumption meter via RS485 or LAN: fail-safe (if the meter fails, the inverters are limited across the board to 70%)
Configuration
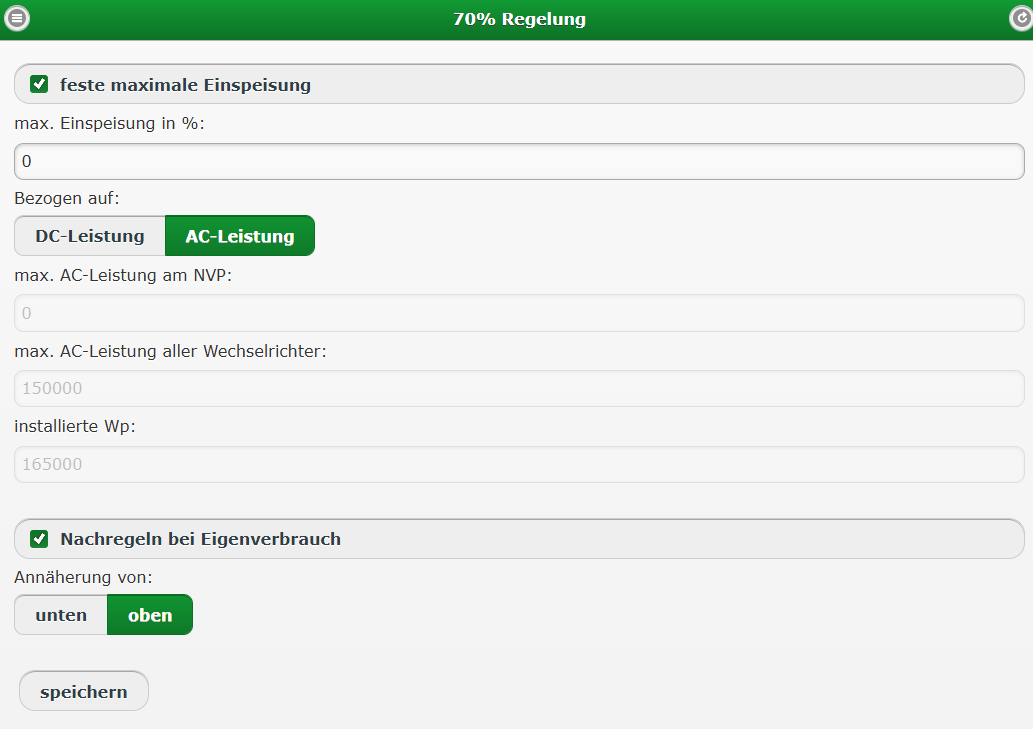
Parameters
Max. feed-in in %: e.g. 70%, or 0% if no feed-in is required
Max. AC power of all inverters: you can enter this value under Configuration => System data
Installed Wp:
Readjust for self-consumption: enable. In this case, the inverter output is readjusted.
Readjustment
During readjustment, the maximum permitted inverter output is increased when the inverter output has reached the current maximum and the power fed into the grid is below 70%.
In simple terms:
A 10 kW system feeds in 7 kW (70%).
If loads in the building can use the remaining 3 kW, the inverters are instructed to produce more power, since this surplus power is not fed into the public grid.
The increase in output depends on the current solar irradiance, and therefore on the maximum output the inverters can currently produce, as well as on the power consumption of the loads.
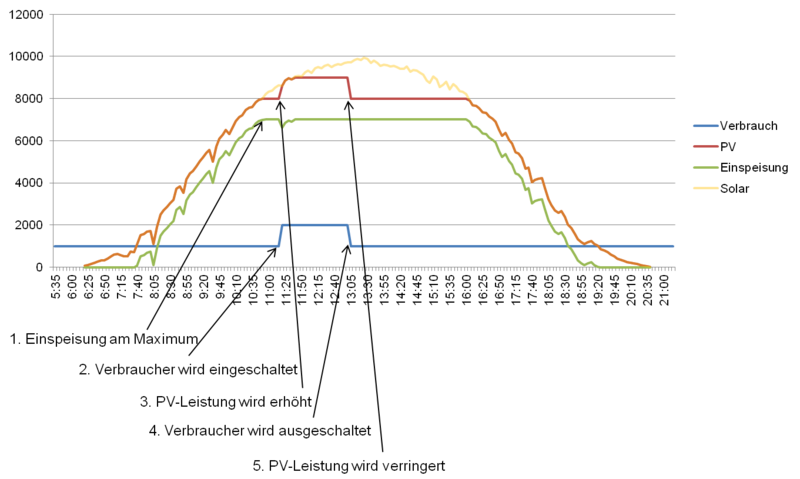
Example
- Consumption is 1kW
- PV output rises to 7kW, feed-in 6kW => power limit raised to 80%
- 1. PV output 8kW, feed-in 7kW => power limit remains at 80%
- 2. An additional load is switched on PV output 8kW, feed-in 6kW => 3. power limit raised to 90%
- PV output 9kW, feed-in 7kW => power limit remains at 90%
- 4. The additional load is switched off
- 5. PV output 9kW, feed-in 8kW => immediate power reduction to 80%
- PV output rises to 7kW, feed-in 6kW => power limit remains at 80%
The e.manager continuously checks whether the power fed into the grid exceeds 70%. If it does, the power is reduced immediately.
A possible increase of the maximum output is checked every minute.
Depending on the update interval of the individual measured values, excess power is usually reduced within 10 seconds.
Caution
If a power reduction is implemented because of grid limitations, the grid load may be increased until the inverters have been throttled back.